
Inline Form Lines lets you instantly view a horse's recent race history without leaving the racecard. Available on all three racecard views: Ratings, At-a-Glance, and Form Expert.
Ratings & At-a-Glance: Click Any Horse Row
On the Ratings or At-a-Glance tabs, click any horse row to expand their last 6 form lines directly below. Click the same row again to collapse them.
- First 6 runs are shown by default for a quick overview
- Click "Show all X form lines" to reveal the full history
- Click the horse row again to close — works whether 6 or all lines are showing
- Opening a different horse automatically closes any previously expanded row
Form Expert: Click Stat Cells for Filtered Form
On the Form Expert tab, each column shows breakdown stats (Runs / Wins / Win%). Click any stat cell to expand the matching form lines for that category.
- Going column: Click a going stat (e.g. "5R 2W 40%") to see only the races run on that going range
- Class column: Click to see races in that class range
- Course column: Click to see races at that course
- Distance column: Click to see races at that distance range
- Field column: Click to see races with that field size range
The form lines shown are server-filtered to match exactly the criteria for that column, respecting any active filters (Going, Class, Distance, Field, Race Type, Handicap, Period).
A header above the form lines tells you the filter applied (e.g. "3 runs — Good To Soft to Heavy").
Colour-Coded Matching
Form lines highlight data that matches today's race conditions in green:
- Course name: Green if the horse ran at today's course
- Class: Green if the class matches today's race class
- Going: Green cell background if the going matches today's going
- Distance: Green cell background if the distance matches today's race distance
This lets you instantly spot relevant form — races run under similar conditions to today.
Form Line Columns
| Column | Description |
|---|---|
| Result icon | Click to view the full result for that race |
| Racecard icon | Click to view the historical racecard for that race |
| Trend icon | Click to see how that race has worked out — opens the Race Workout analysis showing what runners did in subsequent races |
| Date | Race date (hover for full race name) |
| Replay | ATR or RTV replay link if available |
| SR | Proform Speed Rating for that run |
| Pace | In-running position style (e.g. Led, Prominent, Held Up) |
| DR | Draw position |
| Race | Course abbreviation, class, conditions, and prize money |
| Dist | Race distance |
| Going | Official going description |
| Wgt | Weight carried (stones-pounds) |
| Hd | Headgear worn in that race — b blinkers, h hood, p cheekpieces, t tongue-tie, v visor, e eye hood. A highlighted 1 or 2 means first or second time in it, so a change of headgear reads straight down the form (cheekpieces first time two runs ago, hood added today). |
| OR | Official BHA Rating at the time of race |
| My | The figure that run earned on your default My Ratings set (RM Pro / Proform Premium). On a class-par set or the "Speed figures on the OR scale" set it reads like a handicap mark beside OR, so you can see whether a horse ran to, above or below its official rating in every race. Hover a figure for the pre-race figure it carried in. The column appears only when you have an active set; choose it in the column picker like any other. |
| MOR | Median OR of all runners in that race (rounded; excludes non-runners and horses without an OR). Read alongside the horse's own OR to see whether the horse was rated below, at, or above the field's class profile. Empty when none of the runners in the historic race had an OR. |
| Outcome | Finishing position, beaten distance, and winner details |
| ISP | Industry Starting Price |
| PRB | Percentage of Rivals Beaten (0-100 scale) |
| Jockey | Jockey name |
| Trainer | Trainer name |
Stride & Cadence Columns (Proform Premium + Sectionals Add-On)
Turn on the Sectionals toggle on any form-lines table and two biomechanical columns appear alongside the sectional set, so you can read a horse's stride length and cadence for every run without opening each race in turn:
| Column | Description |
|---|---|
| Stride | Average stride length in feet. A long, ground-covering stride points to a horse suited by further. |
| Cad | Cadence — average strides per second. A high cadence marks the sprint profile; a slower one points to further. |
Both columns sort, and both are included in the CSV export. They can also be pinned into the normal (non-sectional) view via the Columns chooser, under a Sectionals group.
Why some runs show a dash: stride is measured by trackside tracking equipment, which covered ARC courses only until RMG courses were added in May 2026. A race can therefore have full sectional times but no stride reading, and those runs show “–” rather than a misleading zero. If none of a horse's runs were tracked, the two columns are hidden entirely rather than shown empty.
Betfair In-Play Columns (RaceMetrics Pro / Proform Premium)
RaceMetrics Pro and Proform Premium subscribers see three extra price columns on every form line by default — the same fields shown in the Proform Race Guides and desktop software — with two more available via the Columns chooser:
| Column | Description |
|---|---|
| BSP | Betfair Starting Price (decimal) |
| IRLo | In-Running Low — the lowest price matched on Betfair during the race |
| IRLo% | In-Running Low as a percentage move from BSP. Negative (shown in red) means it traded that much shorter than BSP in-play — a horse at -90% or more usually came very close to winning. Positive means its price never dipped below BSP |
| IRHi | In-Running High — the highest price matched during the race (add via Columns) |
| IRHi% | In-Running High as a percentage move above BSP (add via Columns) |
Choosing Your Columns (RaceMetrics Pro / Proform Premium)
A ⚙ Columns button sits next to Export CSV above every form-lines table. Pro and Premium subscribers can use it to show, hide and reorder the form-line columns — including the Betfair in-play fields above.
- Your choice is remembered and applies everywhere form lines appear: racecard expansions, Form Expert drill-downs, profile drill-downs, and My Card print
- The Race column is always shown (it carries the Sectionals toggle)
- Reset in the chooser restores the default layout
- The CSV export always includes every field, whatever columns you show on screen
Quick Filters (Proform Premium)
Above every form-lines table sits the same quick-filter strip the Proform desktop software has: All / Wins / Wins & Places on the left, then Turf / A/W (all-weather) / Chase / Hurdles / NHF (National Hunt Flat) and an All button. Use them to restrict the form on display to the runs that matter for today's question — the chase form before a handicap chase, or only the runs the horse has won.
- Wins keeps only the runs the horse won. Wins & Places keeps the runs it won or was placed in, using standard each-way places for the field size: second in a 5–7 runner race, second or third from 8 runners, second to fourth in a 16-plus runner handicap (second or third in a 16-plus non-handicap). Nothing counts as placed in a race of fewer than five runners.
- Untick a race type to hide those runs. The All button ticks every type — or unticks every type if they are all ticked, exactly as the desktop button does. Untick them all and the table says so rather than going blank.
- Changes apply straight away, with no Apply button, and to every form-lines table on the page.
- While a filter is active the strip turns amber and shows how many of the horse's runs match (“4 of 18 runs”), and the footer reads “Showing 4 of 18 runs”. The filter is remembered for every horse and every race until you change it — so if a horse seems to have fewer runs than you expected, check the strip.
- Break lines are hidden while a filter is active: a gap between two filtered runs is the filter, not a layoff. First-time-headgear and trainer-change lines still read the horse's full history, so they stay correct.
- Export CSV exports the runs you can see, so a filtered table gives a filtered file.
- On the My Card tab the My Last column (your last few My Ratings figures for each horse) follows the same filter, so with Chase ticked alone it shows the horse's last figures over fences. The cell turns amber and its tooltip says how many of the horse's last 20 rated runs match. The My column beside it, the print page and the CSV keep the unfiltered figures.
- Quick filters are a Proform Premium feature. Everyone sees the strip; outside Proform Premium it is locked, and it is not part of RaceMetrics Pro. The My Card print page always prints the whole record.
Sectionals Toggle (Proform Premium)
If you have a Proform Premium subscription with the Sectionals Add On, a purple Sectionals pill button appears in the Race column header of the form lines table.
- Click Sectionals to switch the right-hand columns from standard data (Going, Wgt, OR) to sectional data — Dist stays in view so you can always see the trip each run was over
- Click again to switch back to the normal view
- Your preference is remembered across page refreshes and race navigation
When the Sectionals toggle is active, the following columns replace the standard ones:
| Column | Description |
|---|---|
| Dist | Race distance (rounded). Hover for the exact distance. Sortable like the standard-view Dist column |
| ActGng | Actual going (post-race), kept next to Dist so each sectional performance reads against both the trip and the ground. Sorts by firmness, like the standard-view ActGng column |
| Race Pace | Colour-coded pace bar showing how each furlong section compared to par time. Green = faster, red = slower. Hover for full race details including conditions, result, jockey, trainer, and section-by-section breakdown |
| Style | Running style classification with icon (e.g. Led, Prominent, Mid-Division, Held Up) |
| Pos Track | Position at key race stages showing how the horse moved through the field |
| +/- | Net positions gained or lost from start to finish |
| Adj | Adjusted finishing position change based on sectional data — how many places the horse should have finished higher (positive) or lower (negative) had it run the race more efficiently |
| MaxU | Max upgrade in pounds from the last 4 furlongs — how many pounds the horse could have improved by running the section more efficiently. Click the column header to sort by MaxU (descending, then ascending, then back to date order) |
| FS 2f | Finishing Speed % difference vs par at 2 furlongs out. Hover for mph |
| FS 1f | Finishing Speed % difference vs par at 1 furlong out. Hover for mph |
| FS Fin | Finishing Speed % difference vs par at the finish. Hover for mph |
Sectional data is only available for races where sectional timing was recorded. If a past race has no sectional data, that row will show dashes in the sectional columns.
Days Since Last Run (DSLR)
The DSLR column, beside the Date, shows how many days each run came after the one before it, so the breaks a horse has had read straight down the form: a quick return, a summer off, a long layoff before a win. It is blank on a debut. RaceMetrics Pro and Proform Premium members who have already chosen their own form-line columns can add it from the Columns button.
Trainer trend (T Trend)
The T Trend column, after the Trainer, shows the yard's form at the time of each run: how far that trainer's RaceMetrics Rating had moved in the 14 days before the race (the same arrow and colours as the racecard's trainer trend pill). Hover a figure for the 28-day move and the runs behind both. It is in the CSV export too. Members with their own column choice can add it from the Columns button.
Click-to-Sort & Persistent Preference
Every column header in the form-line table is clickable. Each click cycles through three states — none → descending → ascending → none — with a small arrow showing the active sort. The sort uses the actual underlying value, not the displayed text:
- ISP: parsed to decimal odds-against (so “11/4 (2F)” becomes 2.75, “Evens” becomes 1.0, “4/5” becomes 0.8). Ascending puts the shortest prices first — favourites at the top.
- Wgt: parsed to total pounds (“10-7 t” becomes 147 lb), headgear suffix ignored.
- OffGng / ActGng: sorted by firmness rank (Hard → Firm → Good To Firm → Good → Good To Soft → Soft → Heavy, with the AW codes after). Ascending puts the firmest going first — not alphabetical.
- Date: sorted by race ID (monotonic with chronology).
- Outcome: sorted by finishing position; non-finishers sink to the bottom on ascending sort.
- SR · DR · DSLR · OR · MOR · PRB · GA · T Trend: direct numeric (a debut's blank DSLR, and a run with no trainer trend, go last).
- Pace · Jockey · Trainer · Style: case-insensitive alphabetical.
Your last sort choice is saved in your browser and re-applied automatically — both on the racecard popup (Ratings / At-a-Glance / My Card / Handicap) and inside the profile breakdown drill-down popup. Reload, switch race, click into a different horse, or open a breakdown row — the sort comes with you.
Export to CSV Proform Premium
An Export CSV button sits at the top right of every form-line table. Premium members get a CSV file containing every column the table shows — plus race ID, race name, comment-in-running, and all sectional fields (when sectional data is present). UTF-8 encoded with a BOM so Excel opens it cleanly. CRLF line endings; commas inside fields are properly quoted.
On the racecard popup the button is gated to Proform Premium — non-Premium accounts see a locked button that triggers the upgrade prompt. Inside the profile breakdown drill-down the button is already unlocked because you needed Premium to open the popup in the first place.
Mobile View
On smaller screens, some columns (SR, Pace, DR, OR, ISP, Jockey, Trainer, Weight) are hidden to keep the essential information visible. The table scrolls horizontally if needed.
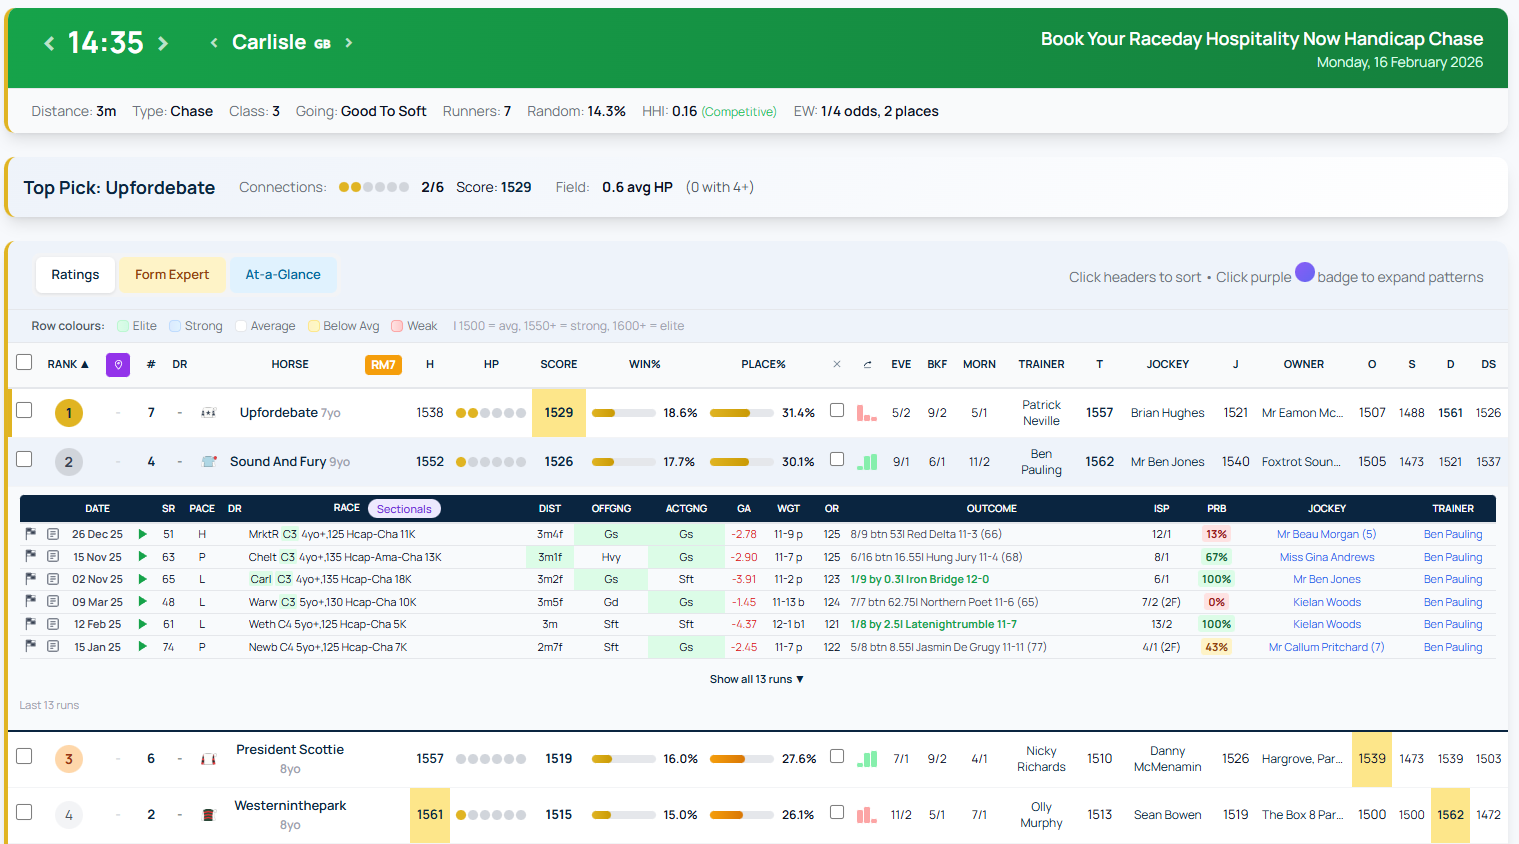
Inline form lines expanded below a horse row, showing recent race history with colour-coded course and distance matching