Track horses, trainers, jockeys, owners, sires, dams, and damsires
RaceMetrics Ratings
Proprietary performance ratings updated daily each morning. Track form across 7 connection types: horses, trainers, jockeys, owners, and bloodlines.
Pattern Discovery
Save profitable angles and see alerts highlighted on racecards when your patterns match runners.
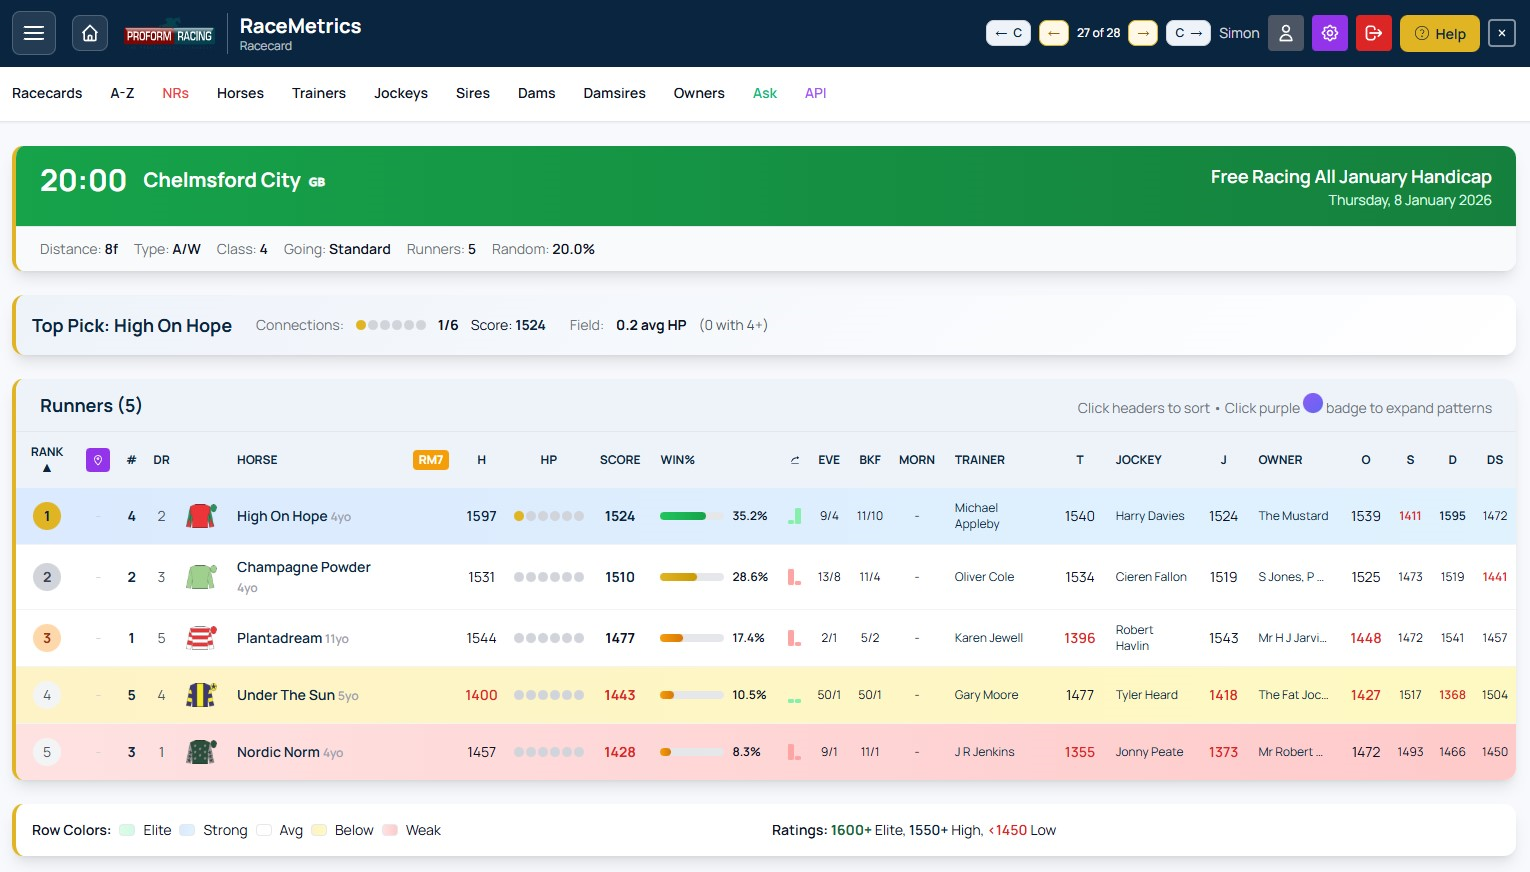
Enhanced Racecards
Full racecards with combined Score ratings, win probability, and detailed connection analysis.
P/L Analysis
Betfair SP profit/loss tracking on every profile. Find consistent performers.
Biggest Movers
Track who's in form and out of form. Spot participants hitting a purple patch or experiencing a dip.
A-Z Runners
All declared runners at a glance sorted by Score. Filter and see pattern matches highlighted.
Race Results
Full results with finishing positions and rating changes for all 7 connection types after every race.
Form Expert
Deep-dive form analysis on racecards. Filter historical stats by going, class, age, distance, field size, and race type. Match race conditions instantly.
Sectional Analysis Premium Add-On
Every furlong timed. 13 analysis tabs of split-time data — times, finishing speed %, stride, upgrades and more — with the race par alongside. See the suite →
Future Form Enterprise
See where today's runners are heading next. Future entries with course, distance, going preferences, and days between runs.
3D Collateral Form Enterprise
Interactive 3D network showing how runners connect through shared opponents. See who has the collateral edge.
Draw & Pace Enterprise
Heatmap crossing draw position with running style. See which stall and pace combinations win at each course and distance.
Trip Predictor Enterprise
Find every horse's optimal trip. Surface-stratified going (Soft Turf vs Standard Polytrack vs Standard Tapeta), distance, class and field-size preferences with confidence levels and form trend.
Handicap Analysis Enterprise
Three signals on every handicap: Speed-Form vs class par, Mark Edge vs last winning OR, and a Hot/Soft Index that scores how competitive the race is. Per-runner sparklines, pattern matching, and auto-generated race insights.
Market Movers Enterprise
Track the full daily price walk for every runner — Evening → Breakfast → Morning, plus BSP for past races. Fractional, decimal and implied % per snapshot, three colour-banded movement columns, and a per-period Book % so you see exactly who is being backed and when.
My Card — Custom Racecard Enterprise
Build your own racecard from 100+ columns drawn across every analytical tab — Ratings Analysis, Future Form, Best Fits, Draw & Pace, Handicap, Predicted Styles, Collateral and Market Movers. Drag-reorder, save named layouts, set per-context defaults, and switch between layouts per race.
Command Centre Proform Premium
3D performance heatmap for any participant. Visualise win rates across course, distance, going and class in an interactive landscape.
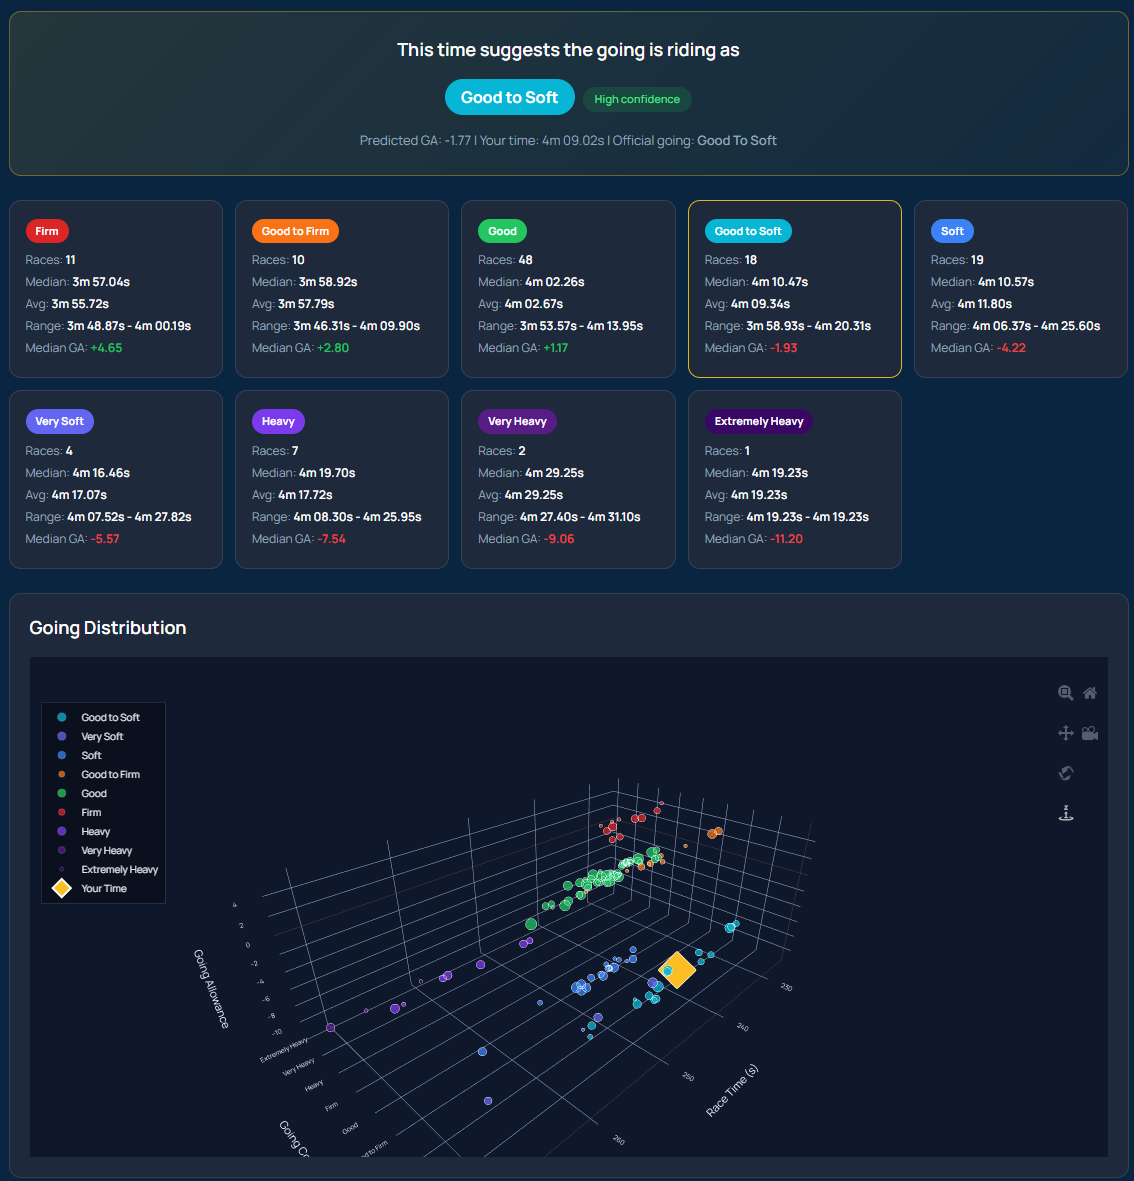
Going Predictor Proform Premium
Enter a race time and see what going the ground is really riding as. 3D scatter plot with historical race time analysis.
Ratings Analysis Proform Premium
Build your own composite rating from 12 sources, save it as a system, backtest historically, and export qualifiers as CSV for ProForm import.
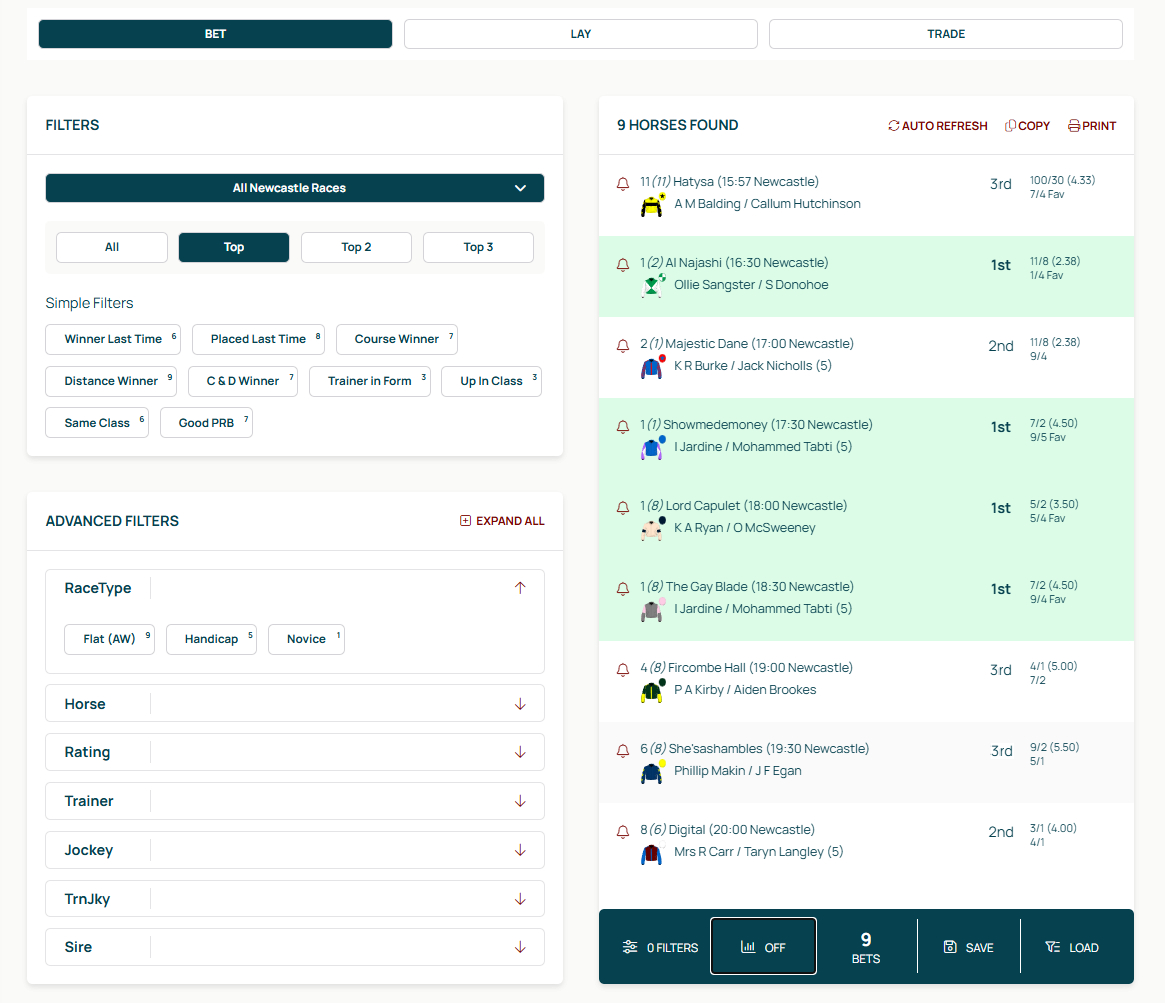
Find bets, lays or trades on the move. Choose your filters and display your selections instantly.
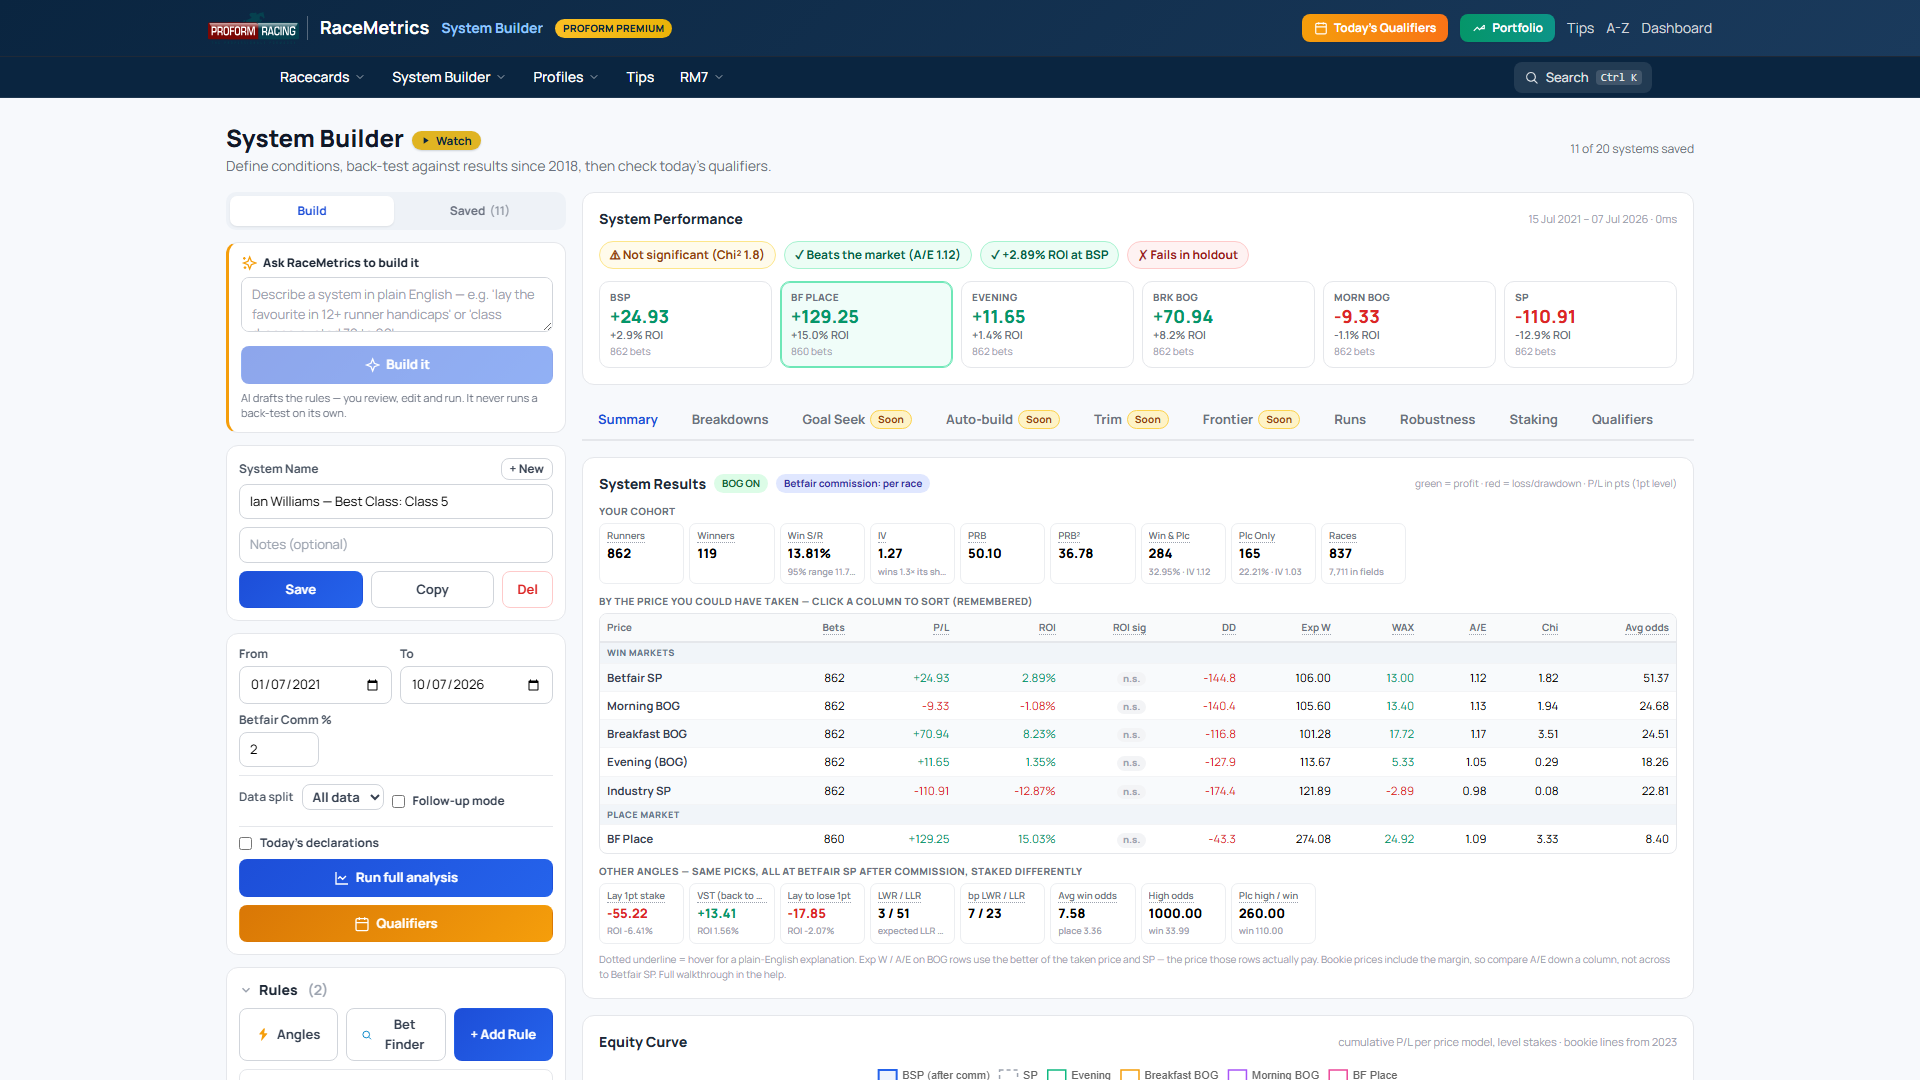
System Builder Proform Premium
Back-test any angle against every UK & Irish run since 2018 at real market prices — then get the qualifiers on your racecards every morning.
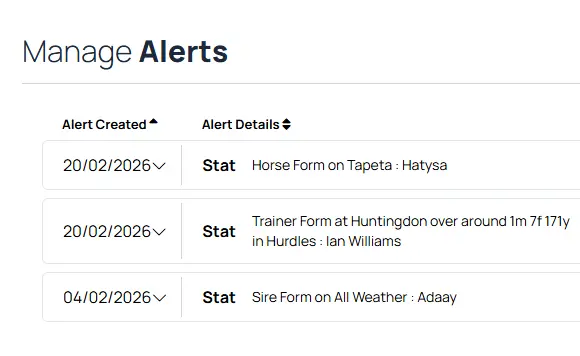
Statistical Alerts Proform Premium
Save alerts from any statistic. Track patterns over time and get live updates when angles become relevant.
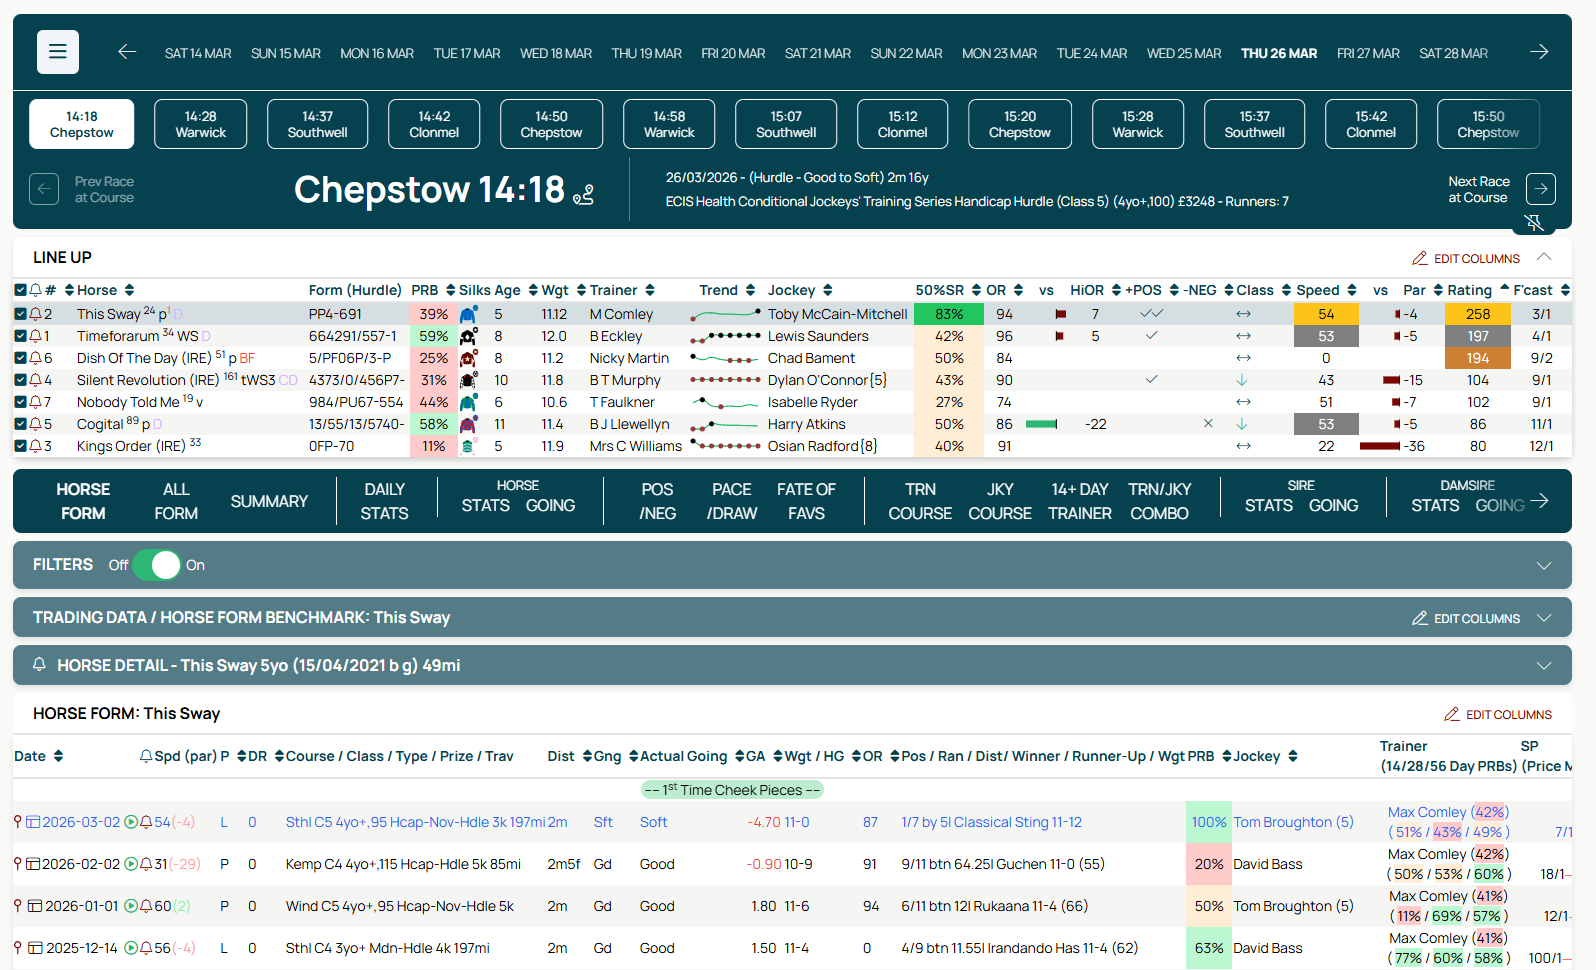
Race Guides Proform Premium
Comprehensive race analysis with form, statistics, pace, draw, connections, bloodlines and trading data.
RACECARD FEATURE
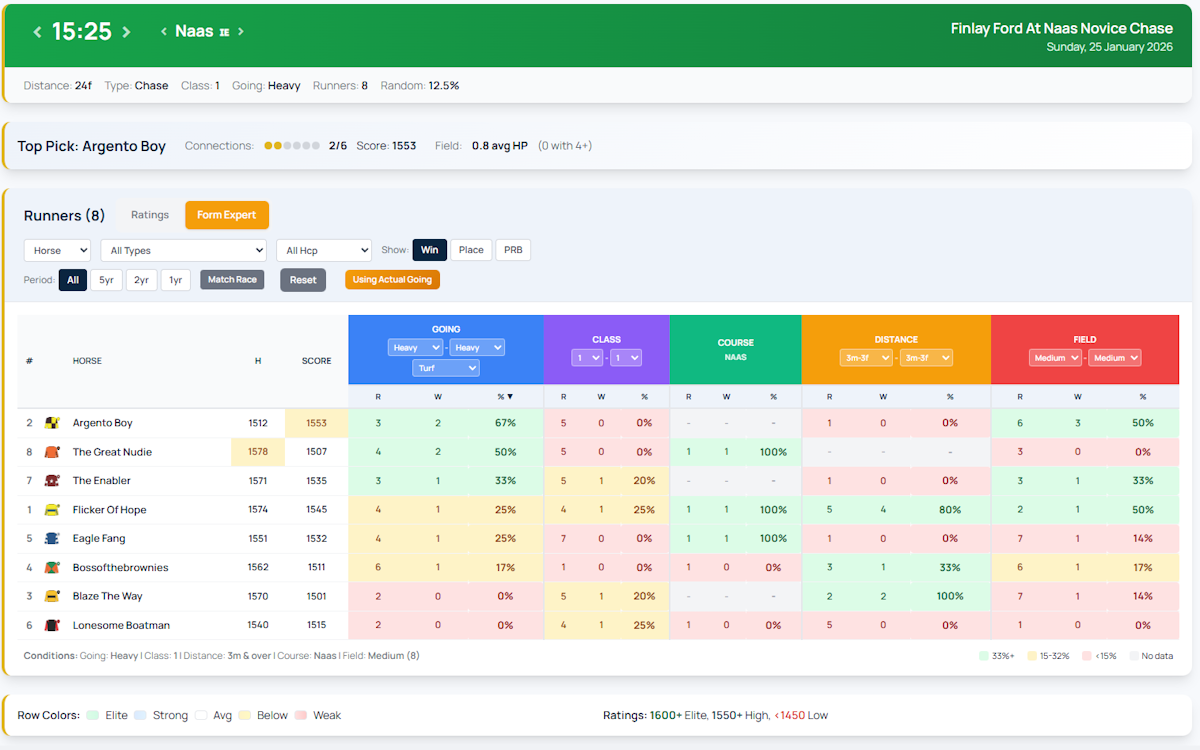
Form Expert
Analyse historical performance for every runner on the racecard. Filter by going, class, age, distance, field size, race type, and surface to find the real form standouts.
✓Match Race – One click to filter for today's exact conditions
✓7 Participant Types – Switch between horse, trainer, jockey, sire, dam, damsire, and owner stats
✓Win / Place / PRB – View wins only, places (1-4), or percentage of rivals beaten
✓Period Filters – All time, 5 years, 2 years, or 1 year recent form
AI-powered race analysis delivered daily. Every runner in every race scored and assessed with insights on pace, form, trainer-jockey combos, speed figures, and more.
✓AI Scoring - Every runner scored based on multiple data points
✓Plain English Insights - Key strengths and concerns for each runner explained clearly
✓Every Race Covered - Full coverage of all UK and Irish meetings daily
✓Meeting & Time Views - Browse by course or chronologically across all races
1415More Radio Maiden Hurdle (Class 4)Good to Soft
#5Secret Des Lune
49
⚡ solid power rating (30%+), ⚡ positive LTO speed vs par, ⭐ proven at this level
#1Double The Dance
49
⚡ strong power rating (40%+), ⚠️ trainer out of form, 🚀 likely to lead
#3Getmyfriend
43
⚠️ pace may not suit.
ENTERPRISE EXCLUSIVE
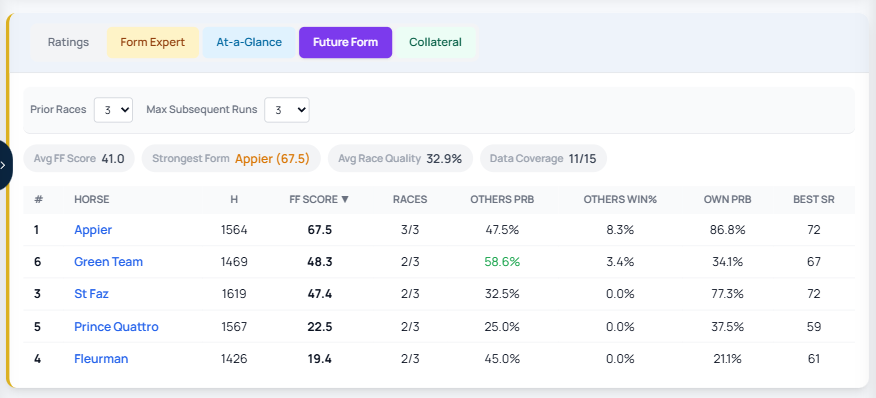
Future Form
See where today's runners are heading next. Future entries reveal trainer intent, campaign plans, and whether connections are treating today as a prep run or going for glory.
✓Next Entries - See confirmed future entries for every runner in the race
✓Course & Distance - Instantly see if the next run is at the same course or over a different trip
✓Days Between Runs - Spot quick turnarounds and campaign patterns
✓Enterprise Exclusive - Available on the Enterprise plan
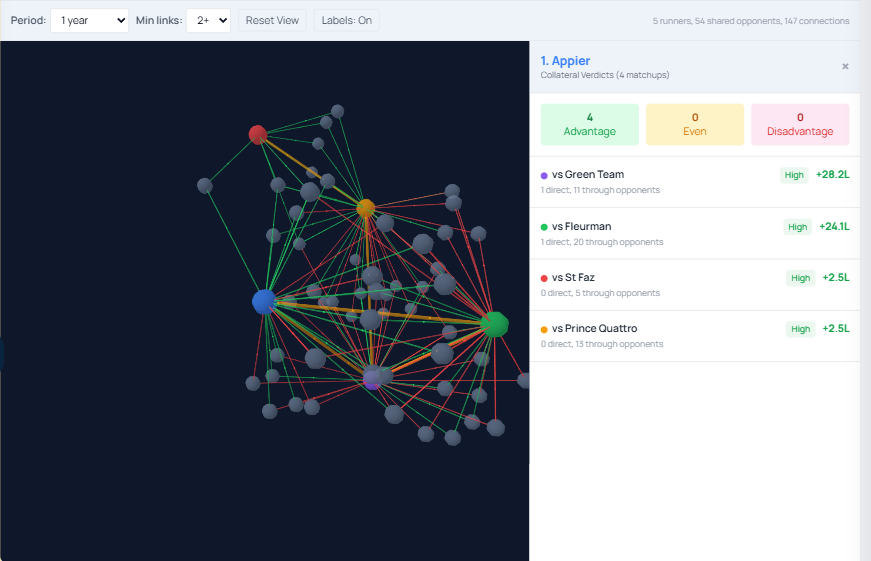
An interactive 3D network visualization showing how runners in a race connect through shared opponents. See who has beaten whom through common rivals and identify the collateral edge.
✓3D Force Graph - Runners as colour-coded nodes, shared opponents as connections, advantage/disadvantage as edge colours
✓Collateral Verdicts - Click any runner to see pairwise matchups with confidence ratings and lengths advantage
✓Weight-Adjusted - Distance-variable lbs/length scale for accurate cross-race comparisons
✓Rankings Table - All runners ranked by net collateral advantage with data point counts
Cross-reference historical draw position performance with running style data to find tactical sweet spots. See at a glance whether a horse has the right draw for the way it likes to race.
✓Draw × Pace Heatmap - 2×3 grid showing which stall group + running style combinations win at this course and distance
✓Pace Forecast - Predicts likely race tempo from runners' historical styles (strong, moderate, or slow)
✓Tactical Score - Distance-weighted composite of draw IV and pace IV for each runner
✓Sweet Spot / Dead Zone - Instantly see which runners are in historically profitable or unprofitable positions
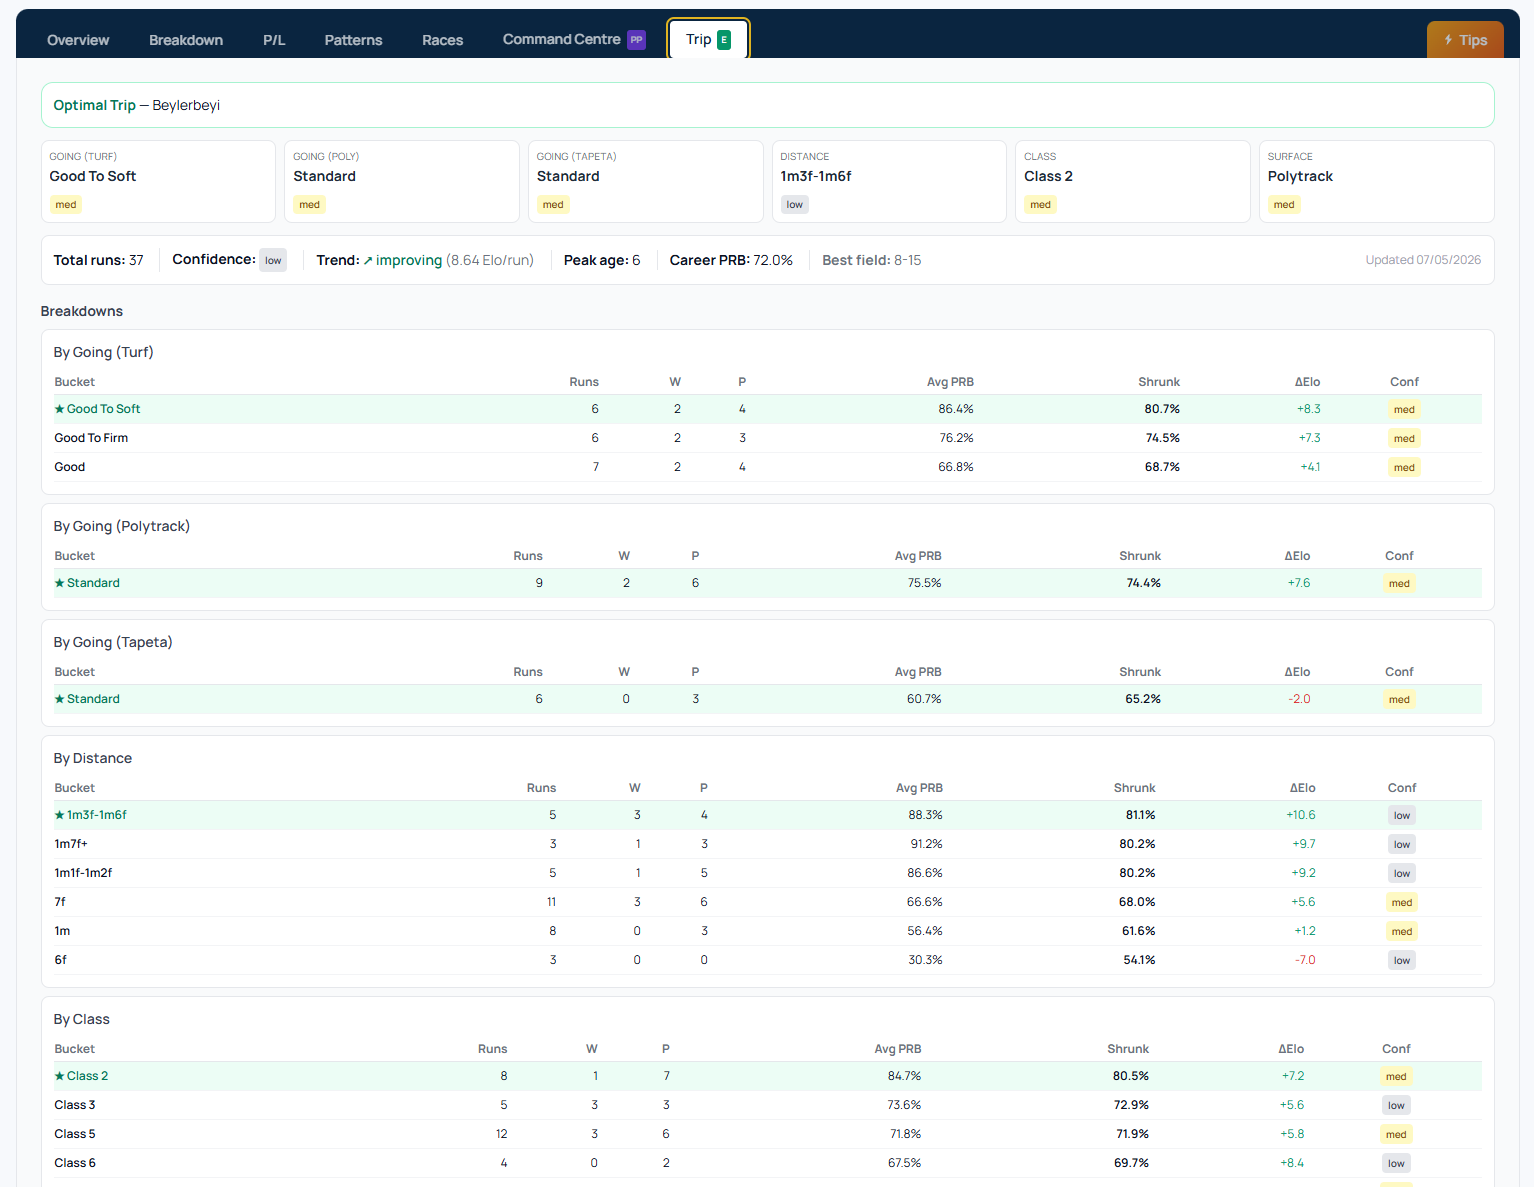
Every horse has conditions where they thrive — and conditions where they don't. Trip Predictor analyses every prior run to surface a horse's optimal trip: preferred going (per surface), distance, class and field size, with confidence levels and a form trend. When today's race fits, you'll know.
✓Going by surface – turf, Polytrack and Tapeta kept distinct because horses can prefer one over the other
✓Bayesian-shrunk confidence – high / med / low pills based on sample size so you know when to trust the signal
✓Form trend & peak age – improving, peak or declining based on RaceMetrics Rating regression over the last 8 runs
✓Multi-code horses – chase, hurdle and NHF profiles split out separately for jumps horses
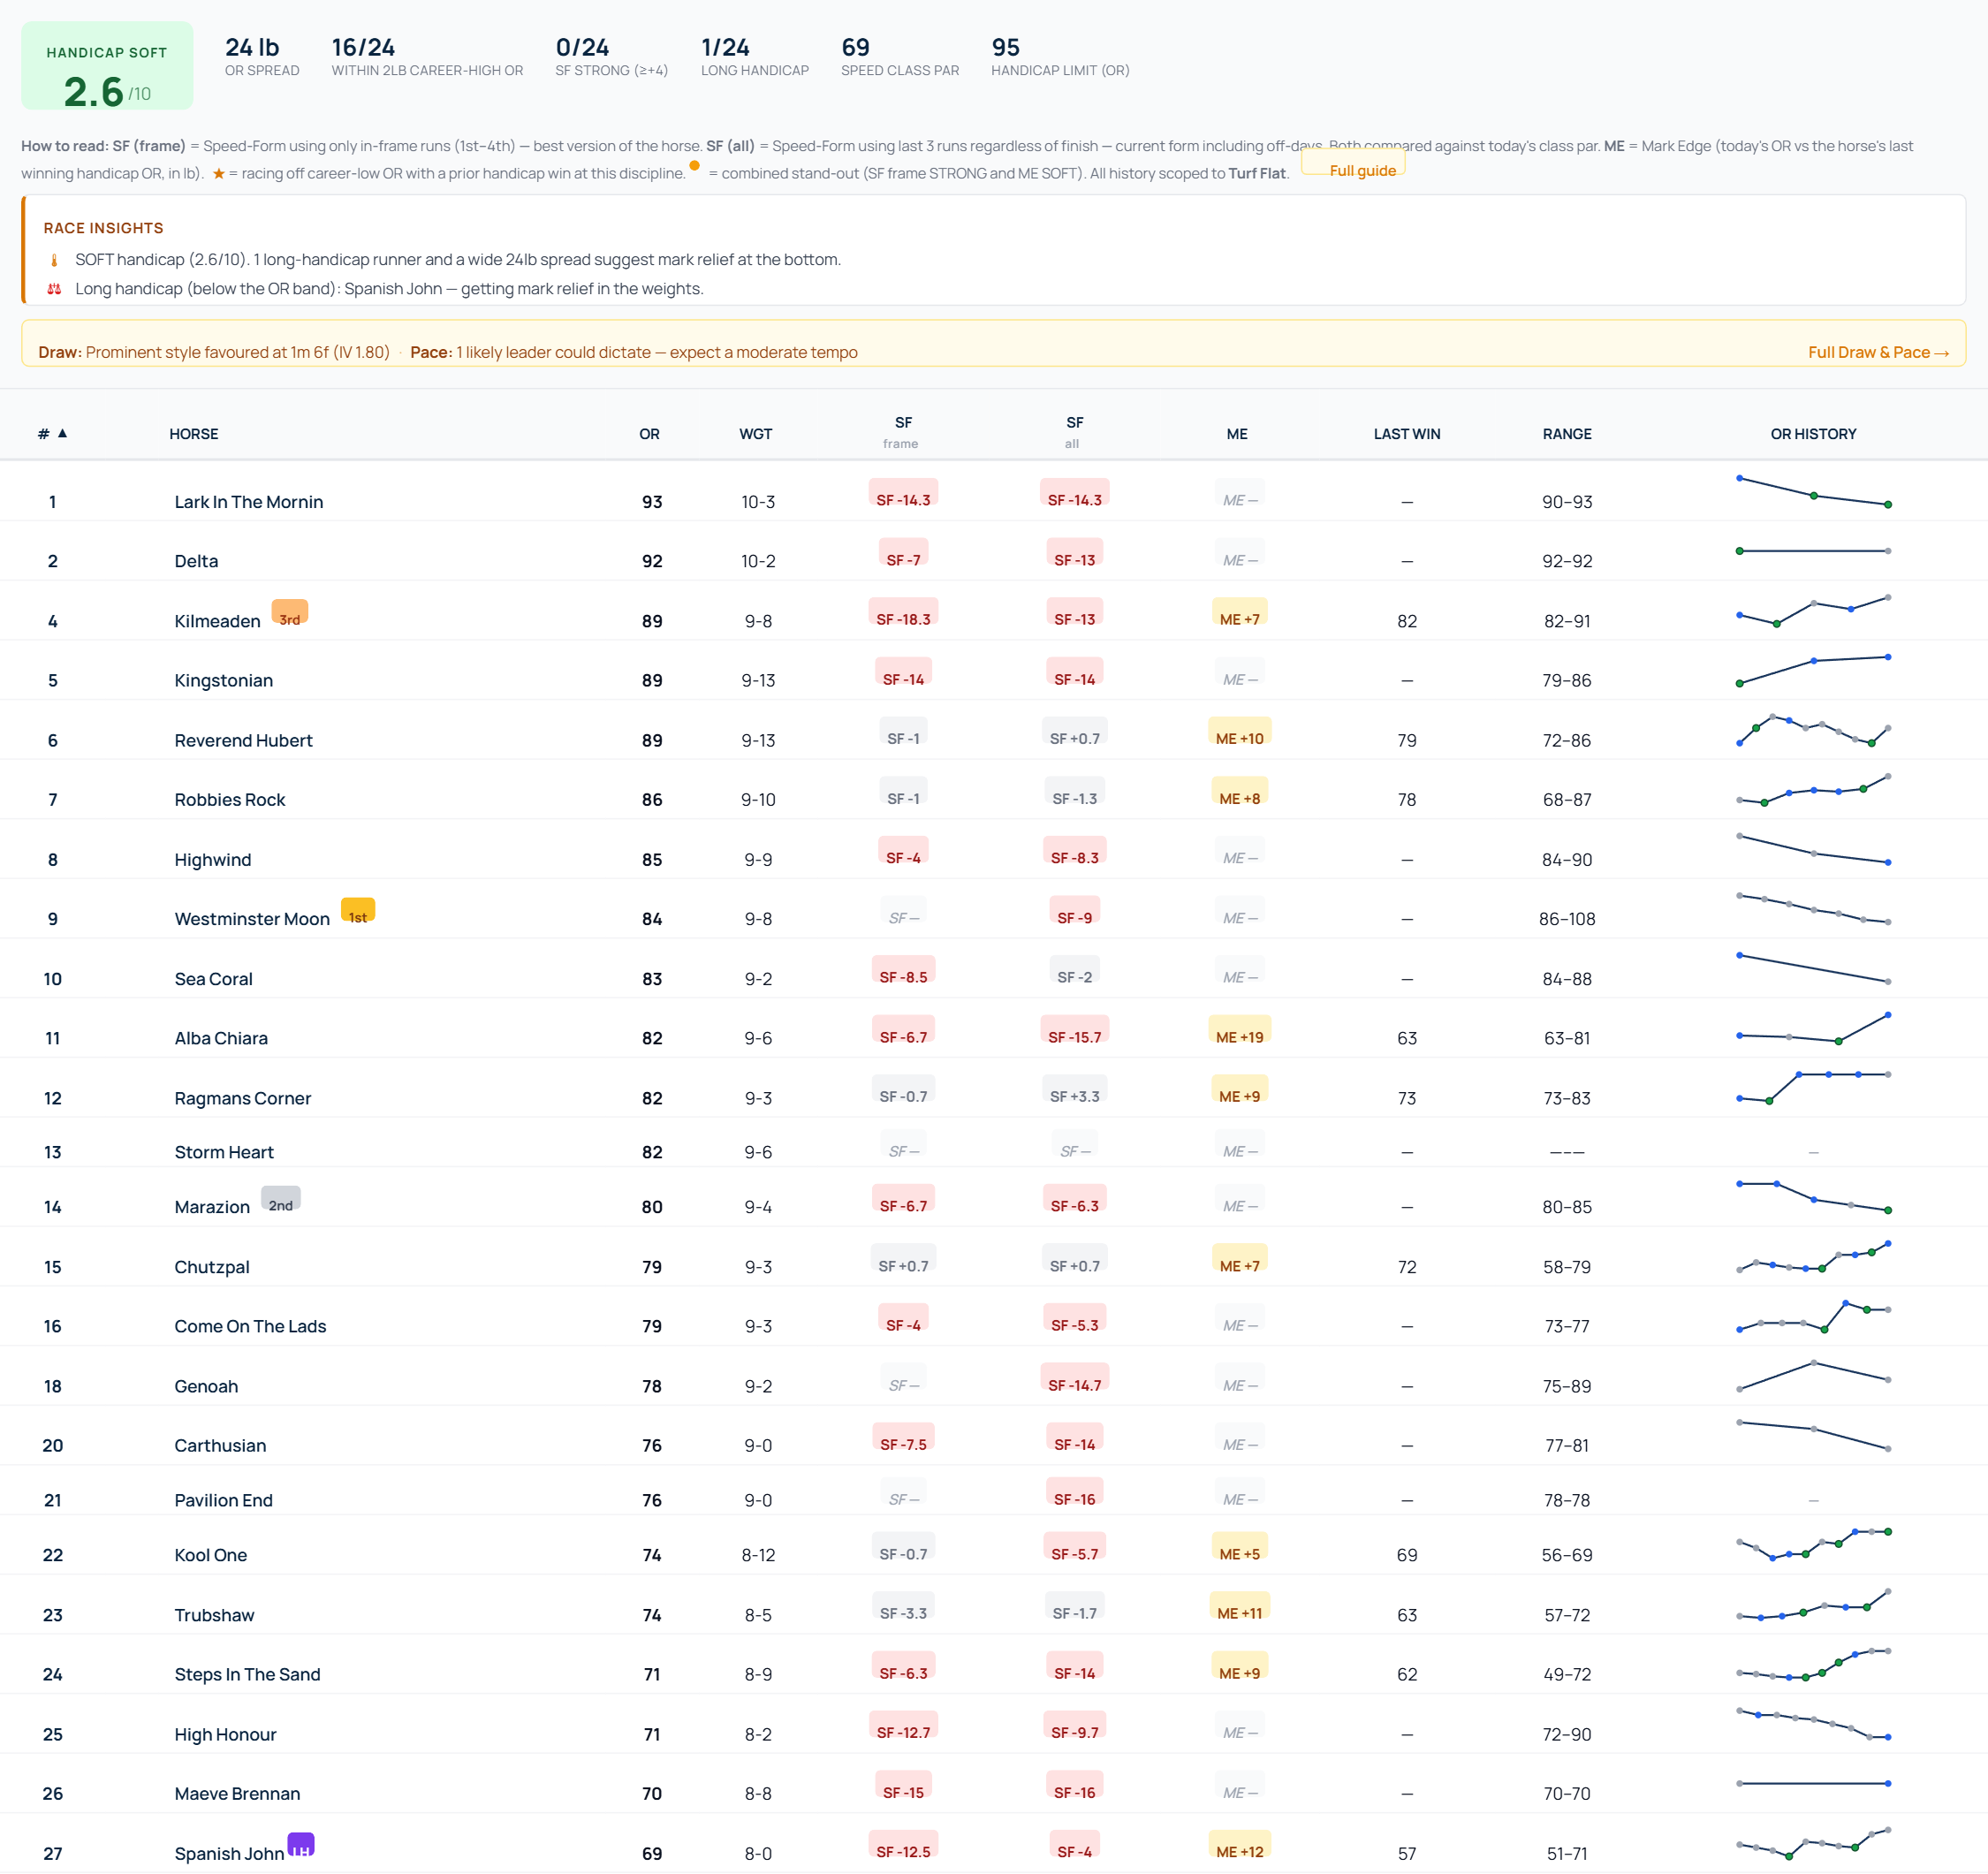
Every handicap gets its own tab with three signals: Speed-Form vs class par, Mark Edge vs last winning OR, and a race-level Hot/Soft Index that scores how competitive the race is. A combined gold-dot stand-out flags any runner that is both racing off a soft mark and in strong recent form.
✓Hot/Soft Index – one-glance 0–10 dial showing whether the field is tight and competitive or open with value lower in the weights
✓Discipline-scoped OR history – Flat / All-Weather / Chase / Hurdle kept separate because the OR scale itself differs between codes
✓Sweet-spot mark detection – click any sparkline to see which past conditions matched today and how the horse performed under them
✓Auto-generated Race Insights – plain-English commentary on temperature, stand-outs, career-low marks, long-handicap runners and limited-form alerts
✓Pattern matching – expanded chart overlays today's going, distance, class, course and field-size onto every past run so you can see at a glance which results are relevant
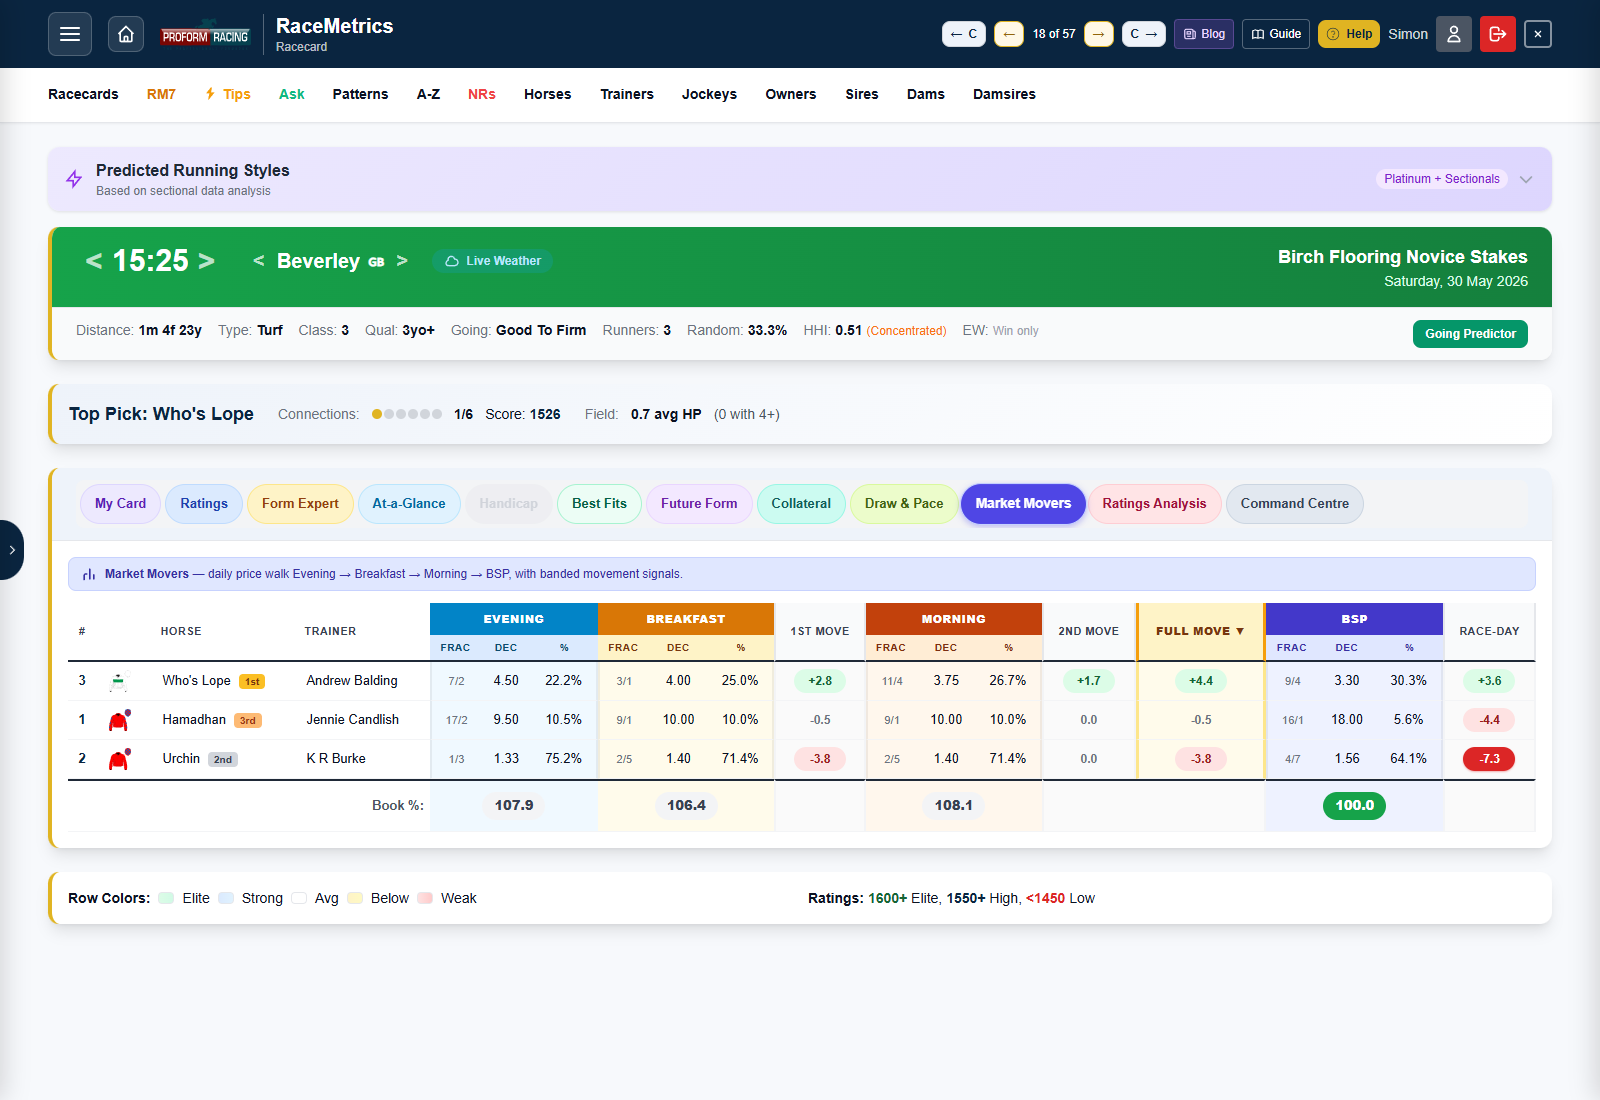
See the full daily price walk for every runner — Evening → Breakfast → Morning, plus BSP for past races. Three colour-banded movement columns surface the steamers and drifters at a glance, with per-period Book % showing exactly how the bookies' margin tightens into off-time.
✓Three odds groups per runner – Evening, Breakfast and Morning each shown as fraction, decimal and implied probability
✓Banded movement chips – six colour bands from strong steamer (deep green pill) through negligible to strong drifter (deep red pill), so you spot major moves without reading any numbers
✓Full Move column – the headline Evening → Morning shift, highlighted as the day's market signal; the table defaults to sorting by this column
✓BSP and Race-day Move on past races – see who got backed all the way to off-time and who drifted away
✓Book % footer – per-period overround coloured by sharpness so you can see the bookies' edge widen or tighten across the day
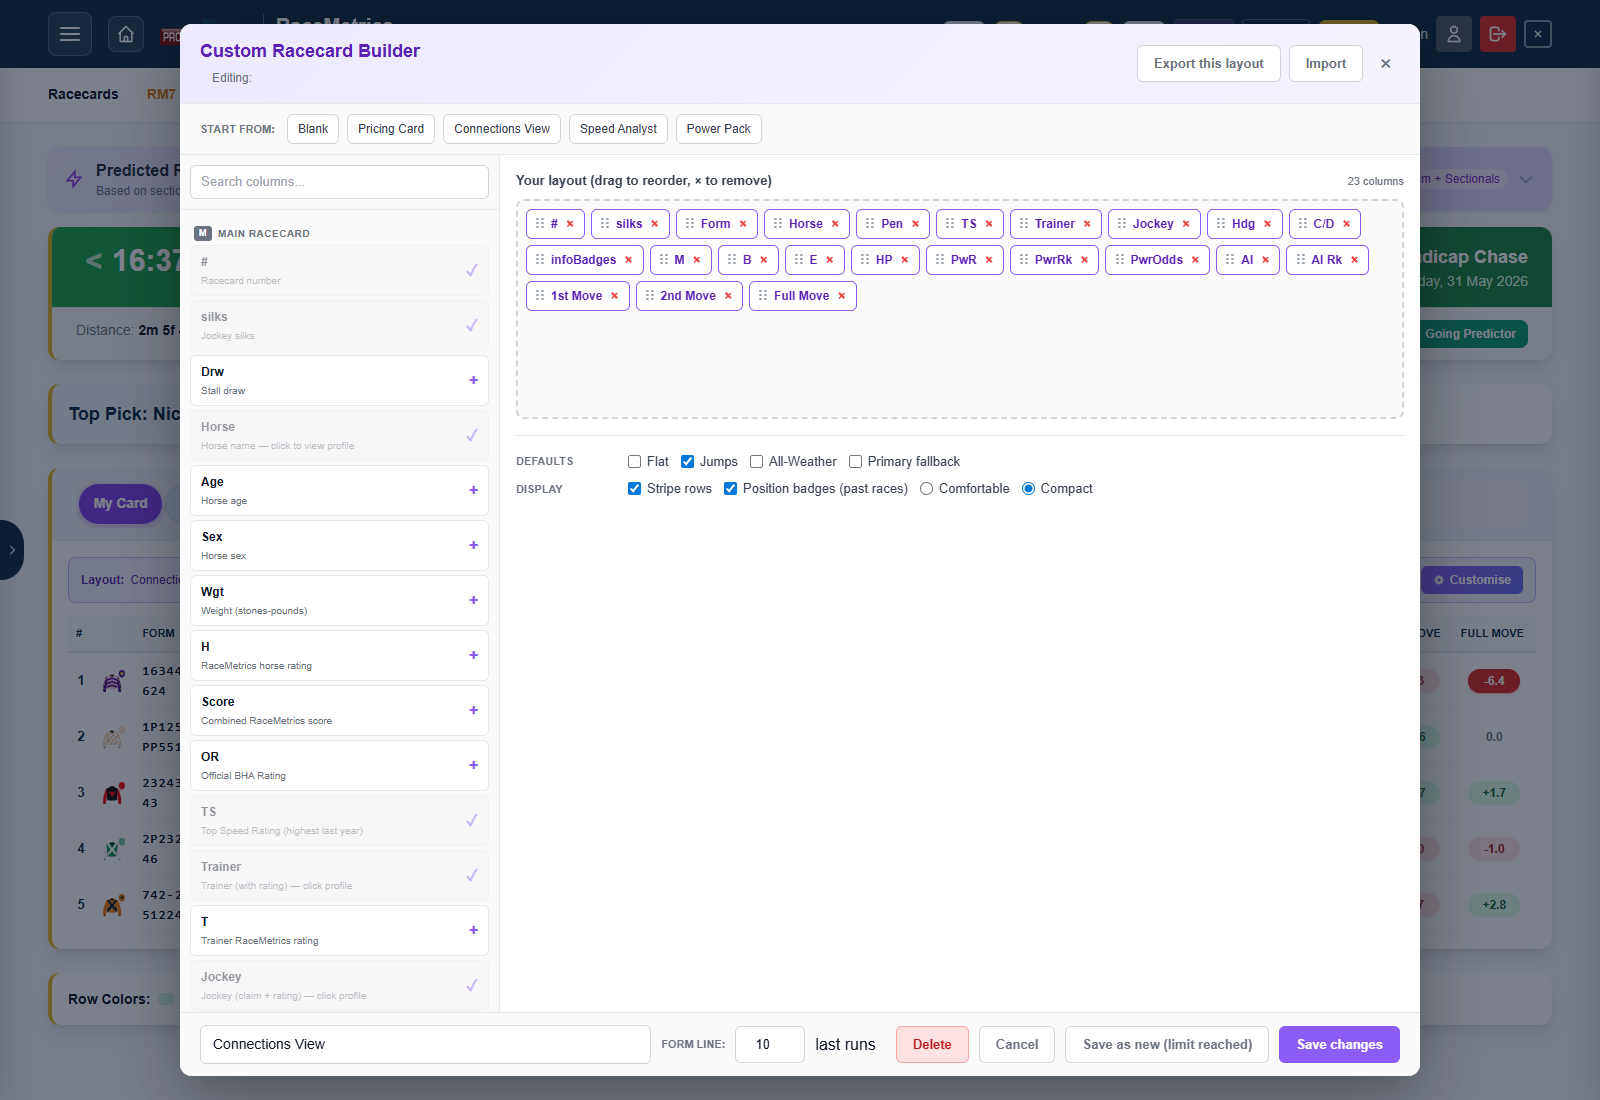
Stop being stuck with the columns we pick for you. My Card lets you build your own racecard from a library of 100+ columns drawn across every analytical tab — Ratings Analysis, Future Form, Best Fits, Draw & Pace, Handicap, Predicted Styles, Collateral and Market Movers. Drag-reorder, customise the form-line length, save named layouts, and switch between them per race.
✓Every analytical field, one card – mix Power Rating, AI, Future Form, Trip Fit, Predicted Style, Collateral and Market Movers in a single sortable table
✓Four curated starter layouts – Pricing Card, Connections View, Speed Analyst and Power Pack (the flagship cross-tab showcase)
✓Per-context defaults – set different layouts as default for Flat, Jumps and All-Weather races so the right one auto-opens each time
✓Form-line customisation – show last 1–10 runs with year-break separators preserved inside your chosen window
✓JSON import / export – share layouts with other users, back up before a re-shuffle, or experiment on a copy
✓1 saved layout on Enterprise, 10 on Proform Premium – layouts built on Premium continue to work for Enterprise users, with Premium-only fields blurred
After race 1, enter the winning time and instantly see what going condition the ground is really riding as. Compare against hundreds of historical races at the same course and distance with a 3D scatter plot and detailed race table.
✓Live Going Verdict - Predicted going based on GA analysis with confidence level
✓3D Scatter Plot - Every historical race plotted by time, going, and GA with your time as a gold marker
✓Granular Going Scale - 11 going descriptions from Firm to Extremely Bottomless using GA mapping
✓Time Equalisation - Adjusts for distance variations at courses with yard-precise measurements
Build your own composite rating from 12 source ratings, save it as a named system, backtest it over thousands of historical races, and export past qualifiers as CSV for import into ProForm. This is the beginning of the web-era equivalent of the Proforms system builder, fully integrated with RaceMetrics’ live data.
✓12-Rating Combine Bar — Horse, Trainer, Jockey, Sire, Dam, Damsire, Owner, Combined, Power, AI, Future Form & Collateral, each with its own slider and within-race rank
✓Saved Systems — Name and reuse any weight + filter configuration across every race
✓Filters & Backtest — Per-rating thresholds (rank, value, clear-by), runner conditions, race conditions; backtest with BSP/ISP/Morning/Breakfast/Evening prices and group by year / class / course / distance / going
✓Configurable CSV Export — Five core columns (COURSE, DATE, TIME, HORSE, RATING) for direct ProForm import, plus tickable extras for rating values, ranks, runner context, prices and settlement data — your column choice is remembered
✓Forward Qualifiers — The same system applied to upcoming races, so today’s selections fall out automatically
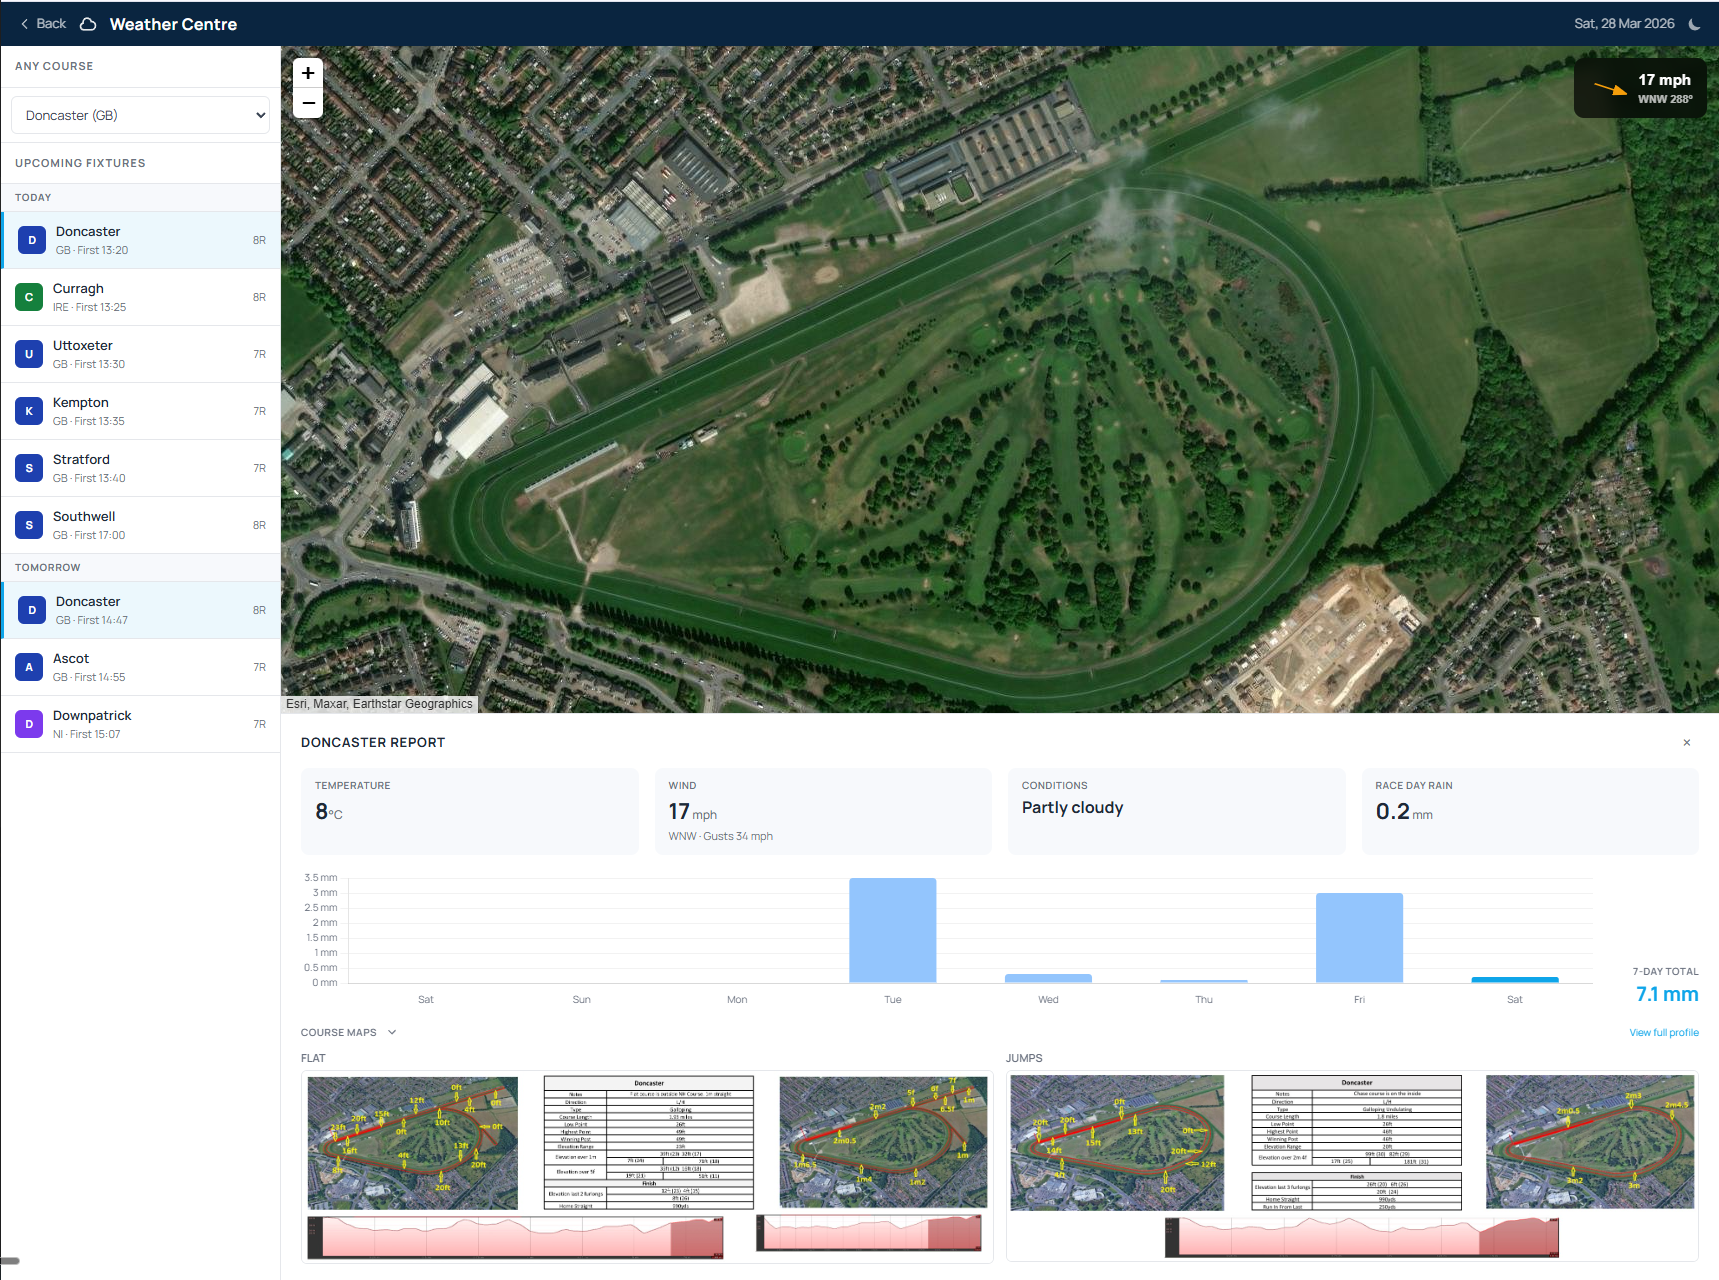
Check real-time weather conditions at any UK or Irish racecourse. Satellite maps, wind direction overlays, and 7-day rainfall history to help you assess the ground before racing.
✓Satellite Course Maps - Aerial view of every racecourse with live wind direction arrow overlay
✓7-Day Rainfall - Daily precipitation chart to judge how the ground will ride
✓Live Conditions - Temperature, wind speed and gusts, humidity, and weather description
✓Track Layout Maps - Proform course maps with distances, elevation, and course characteristics
Describe any bet you can imagine as a set of rules, and test it against every UK & Irish run since 2018 — at real market prices, in seconds. Then let it hand you the qualifiers every morning.
✓Over 400 filters – going, class, trainer form, ratings, prices, pedigree, last-time-out — or just describe it in plain English and let Ask RaceMetrics draft the rules
✓Honest results – profit & loss at six real prices including Betfair SP after commission and best-odds-guaranteed bookie prices, with significance tests on every edge
✓150+ breakdowns – split any system by course, class, month, draw or the trainer's form, and turn a profitable line into a rule with one click
✓Ten staking plans – replay your history under Kelly, level stakes and the famous progressions, with bust-risk measured before a penny goes on
✓Daily qualifiers – save a system and every morning it checks the declarations: one hub page for all your systems, plus badges on the racecards themselves
The Race Guides page is the core of Proform Racing, providing a comprehensive view of every runner in a race along with detailed form data, statistics and analysis tools.
✓Line Up — key data for every horse
✓Data Tabs — form, statistics, pace, draw, connections and bloodlines
✓Filters — filter by time, horse attributes and race conditions
✓Trading Data — Betfair exchange data and dobbing/trobbing statistics
No purchase required to enter.
Open to all registered users. Competition T&Cs
Frequently Asked Questions
What are RaceMetrics ratings?
RaceMetrics ratings are our proprietary performance measure. They track form over time – 1500 is average, 1550+ indicates strong performers, and 1600+ represents elite level. Ratings are updated daily each morning based on the previous day's results.
What connections can I track?
We track seven connection types: Horses, Trainers, Jockeys, Owners, and bloodlines (Sires, Dams, Damsires). Each profile includes full form analysis, ratings history, P/L tracking, and performance breakdowns.
What is RaceMetrics 7?
RaceMetrics 7 is our free weekly skill-based leaderboard competition. Pick 7 participants within a budget and accumulate points based on how their performance rankings change during the week. It's free to enter for all registered users – no purchase required.
Can I cancel my subscription anytime?
Yes, you can cancel your subscription at any time from your account settings. When you cancel, you'll retain access until the end of your current billing period, then your account will revert to the free tier.
What happens if I hit my daily limit?
Daily limits reset at midnight UK time. If you hit your limit, you can either wait for the reset or upgrade to a higher tier for more capacity. Pattern limits are total (not daily) and can be increased by upgrading.
What data sources do you use?
RaceMetrics uses official racing data covering UK and Irish racing. Results are updated daily and include Betfair SP prices for P/L calculations. Our database includes comprehensive historical performance data.
Ready to get started?
Join thousands of racing enthusiasts using RaceMetrics to discover performance patterns.