Getting started
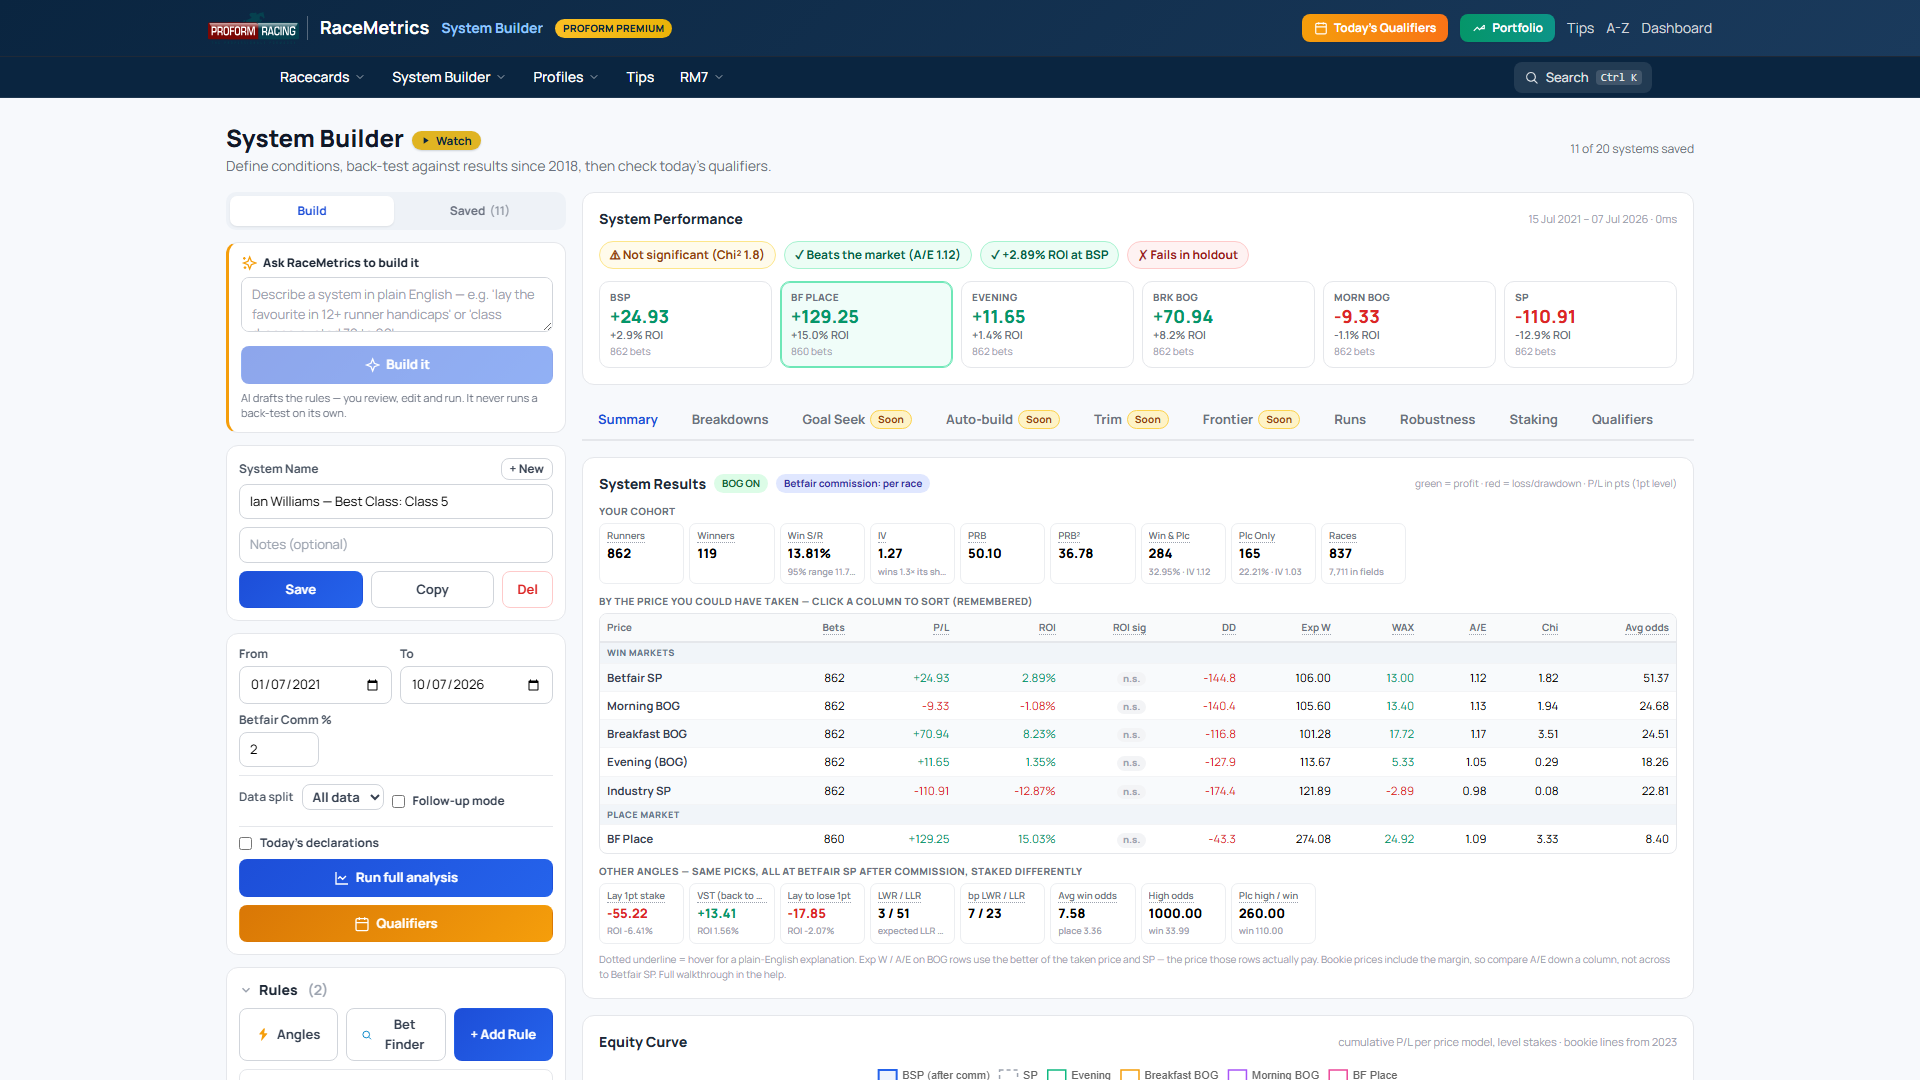
The System Builder is a tool for finding, proving and following betting angles. You describe a kind of runner with a set of rules — "horses dropping in class", "well-fancied favourites at Ascot", "course-and-distance winners on soft ground" — and it instantly shows you how those runners have actually performed across every UK and Irish race since 2018: how often they won, whether they were good value, and what profit or loss they would have returned.
It is the online version of the long-running Proform desktop System Builder, rebuilt and extended. Proform Premium
Why bother?
Most punters carry angles in their head — "this trainer is deadly with first-time-out two-year-olds". The System Builder lets you check whether that hunch has ever actually made money, over thousands of races, in seconds. If it has, you can save it and the tool will show you every runner that matches it today. If it hasn't, you've saved yourself the bets.
What you'll do, in five steps
- Build — add rules to describe your runner.
- Back-test — run it and read the record.
- Refine — sharpen it with Breakdowns, Goal Seek and Trim, and sanity-check it with Robustness.
- Stake — pick a staking plan and see how the bank would have grown.
- Go live — save it and watch today's qualifiers.
New here? Read Key ideas — start here next; it explains the handful of terms (value, strike rate, A/E, ROI) that make everything else click.
You don't need to be a maths whiz to use the System Builder, but a few ideas make everything else make sense. Spend five minutes here and the rest of the guide will feel easy.
Odds, stakes and "level stakes"
Odds tell you the return on a winning bet. We use decimal odds: 5.0 means a winning £1 bet returns £5 (your £1 back plus £4 profit). Every back-test assumes you bet the same amount on every runner — "level stakes" of £1 — so the results aren't flattered by clever staking. (How you actually stake comes later, on the Staking tab.)
SP and BSP
SP is the Starting Price — the official industry odds at the moment the race starts. BSP is the Betfair Starting Price, the same idea on the betting exchange, and it's usually a bit bigger (better) than SP. RaceMetrics headlines profit at BSP because it's a fair, publicly recorded price everyone could have got — but it shows SP and bookmaker prices too.
Strike rate — how often you win
Strike rate (SR) is simply wins ÷ runs, as a percentage. A 20% strike rate means one winner every five runners. Useful — but on its own it's misleading: you can have a high strike rate backing odds-on favourites and still lose money, because the winners don't pay enough. Which brings us to the most important idea of all…
Value, and A/E — the number to watch
Value means getting a bigger price than the runner's true chance deserves. The cleanest measure of it is A/E — "Actual over Expected". The market's odds imply how many winners a group of horses "should" have; A/E compares that to how many they actually had.
- A/E above 1.0 — your runners won more often than the market expected. The market under-rated them. That's value — a real edge.
- A/E around 1.0 — bang in line with the market. No edge either way.
- A/E below 1.0 — your runners won less than expected. The market over-bet them (think short-priced favourites).
ROI and P/L — the money
P/L is the profit or loss, in points, to £1 level stakes. ROI (return on investment) is that profit as a percentage of everything staked. +5% ROI means that, on average, every £1 bet came back as £1.05. Small positive ROIs are normal and good — even the sharpest systems rarely beat +10% over big samples.
PRB and IV — finishing well, and winning your share
- PRB (percentage of rivals beaten) — how well your runners finish on average, even when they don't win. A horse beating 8 of 9 rivals scores ~89%. High PRB across a losing system can hint that the angle is sound and just unlucky.
- IV (impact value) — how much more often your runners win than their fair share of the field. IV of 2.0 means they win twice as often as a random runner would.
Sample size — don't trust small numbers
A dazzling record over 30 runners is probably luck. The more runs behind a result, the more you can trust it. Whenever you use a strike-rate or A/E filter, pair it with a minimum-runs filter so you're not fooled by a tiny, fluky sample. As a rough guide, look for hundreds of runs, not dozens.
Over-fitting — the trap
It's tempting to keep adding rules until the past looks perfect. The danger is over-fitting: you've described the lucky winners of history so tightly that nothing in the future fits the mould. The cure is the Robustness tab, which hides the last 12 months, tunes on the rest, then checks whether the edge survives in the part it never saw — and the Data setting, which lets you build on a random half of races and confirm on the other half.
Commission and drawdown — the real-world bits
- Commission — betting exchanges take a small cut (often ~2-5%) of your winnings. The Builder lets you set this so the BSP figures are realistic.
- Drawdown — the worst peak-to-trough dip your bank would have suffered. Every winning system has losing runs; drawdown tells you how deep, so you know what you'd have to stomach.
Qualifiers
Once a system is proven, its qualifiers are the horses running today (or tomorrow) that match its rules — your system, working live.
Every system follows the same loop. You don't have to do all of it — even just Build and Back-test is useful — but the full loop is how you turn a hunch into something you'd actually follow.
- Build. Add rules (filters) describing your runner. The live count under the rules updates as you type, so you always know how many historical runners you're looking at.
- Back-test. Click Run. The Summary tab shows the full record — strike rate, A/E, ROI, profit — plus a bank curve.
- Refine. Use Breakdowns to see where the system works, Goal Seek to find a rule worth adding, and Trim to find rules worth removing. Then check Robustness so you're not over-fitting.
- Stake. On the Staking tab, see how ten different staking plans would have grown (or sunk) the bank — and the risk of each.
- Go live. Save the system. The Qualifiers tab and the cross-system qualifiers hub then show today's matching runners, and "since you saved this" tracks how it's done since.
New to systems? Start from a starter angle — a one-click template that loads a ready-made set of rules you can back-test immediately and then tweak. They're the fastest way to learn what each filter does and to see the shape of a working system.
Know the Proform Bet Finder? The Bet Finder button (next to Angles) opens its BET / LAY / TRADE buttons rebuilt as System Builder rules with the exact same definitions — tick the same combination you'd use on the Bet Finder page, then back-test it over years of history, break it down, and get daily qualifier emails for it. Every Bet Finder button is live, including the trainer-situational ones.
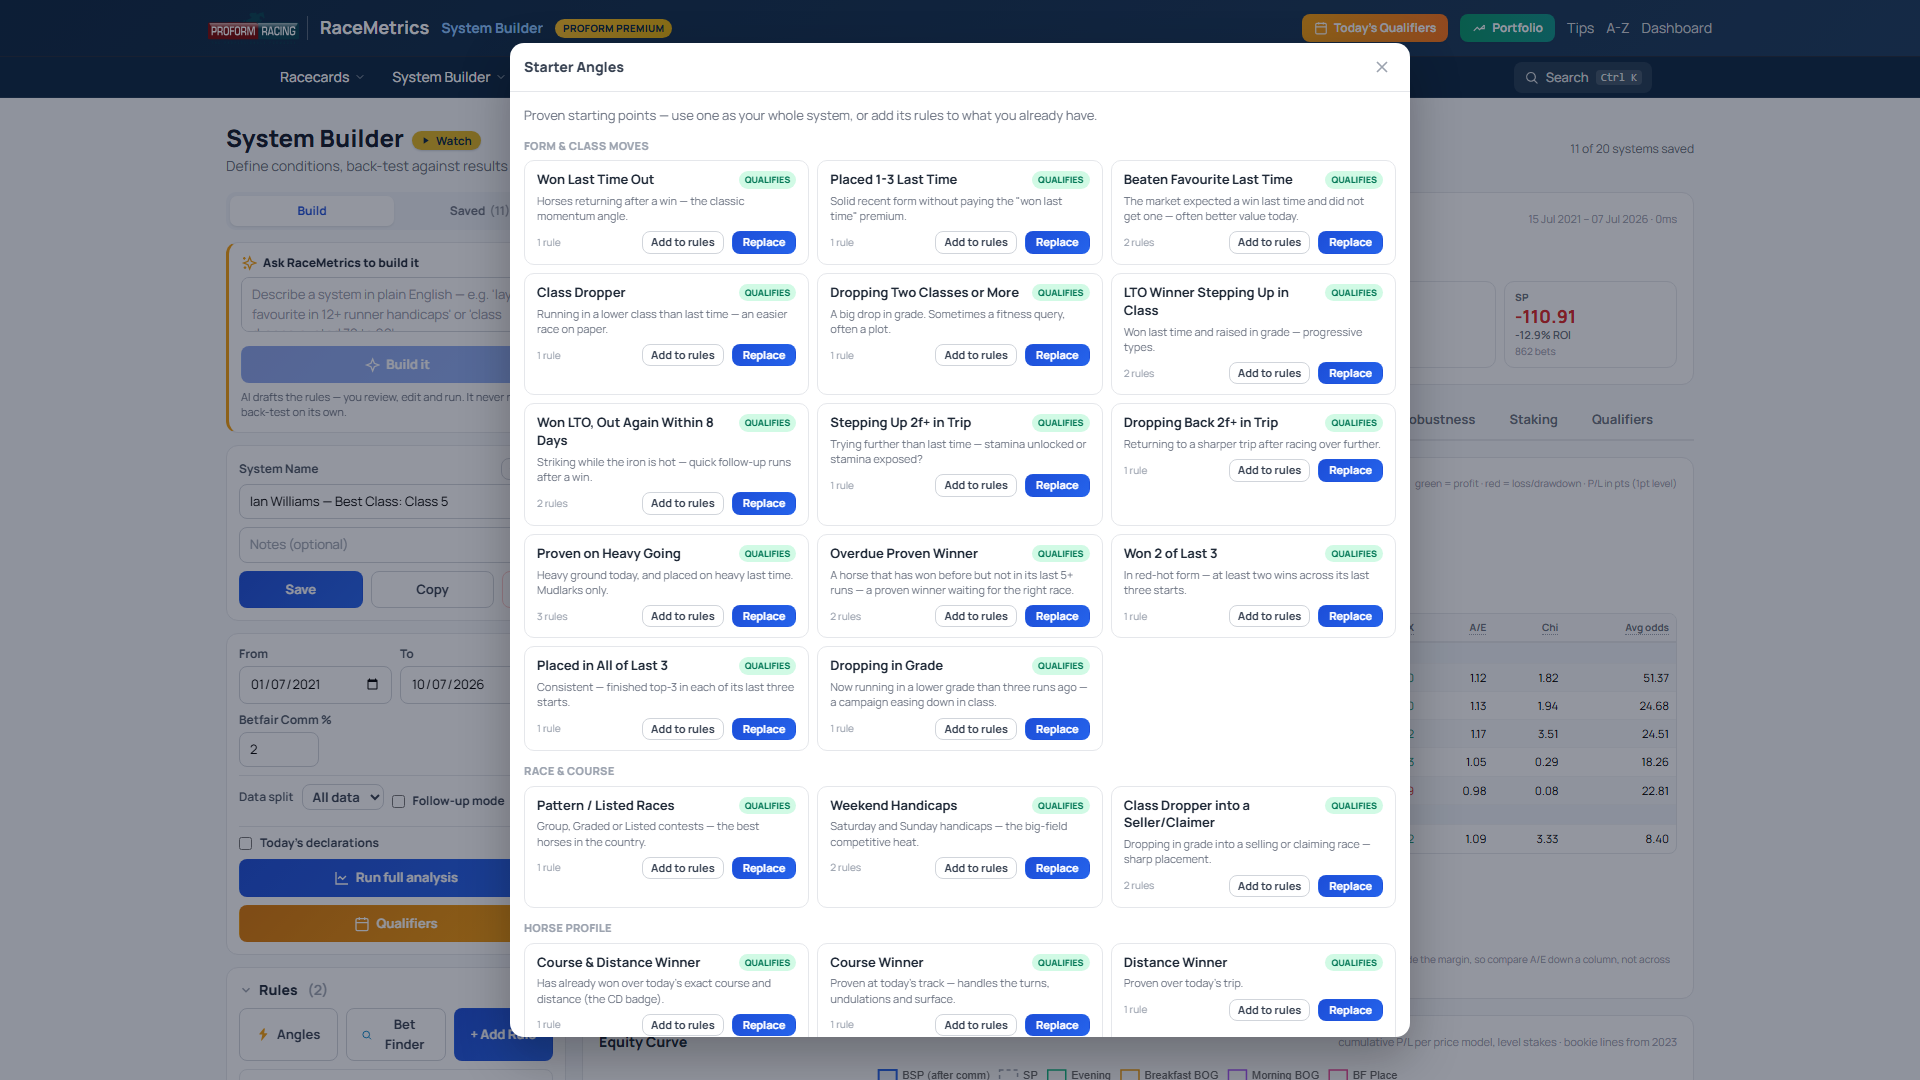
Load one, run it, then open the rules and change a single filter to see how the record moves. Tweaking a real example teaches you far more than starting from a blank page.
If you use the Proform Bet Finder, this panel is for you. The Bet Finder button (next to Angles in the Rules bar) opens every one of its BET / LAY / TRADE buttons rebuilt as System Builder rules — with the same definitions the Bet Finder itself uses. "Course Winner" means exactly what it means on the Bet Finder page: a win at today's course in today's race type. "Trainer Good at Course" is the same trainer record, the same five-year window, the same qualifying gate. Tick the combination you'd normally tick on the Bet Finder, and you get it as a system: back-test it over years of history, break it down by course or class or price, put a staking plan under it, and have its qualifiers emailed to you every morning.
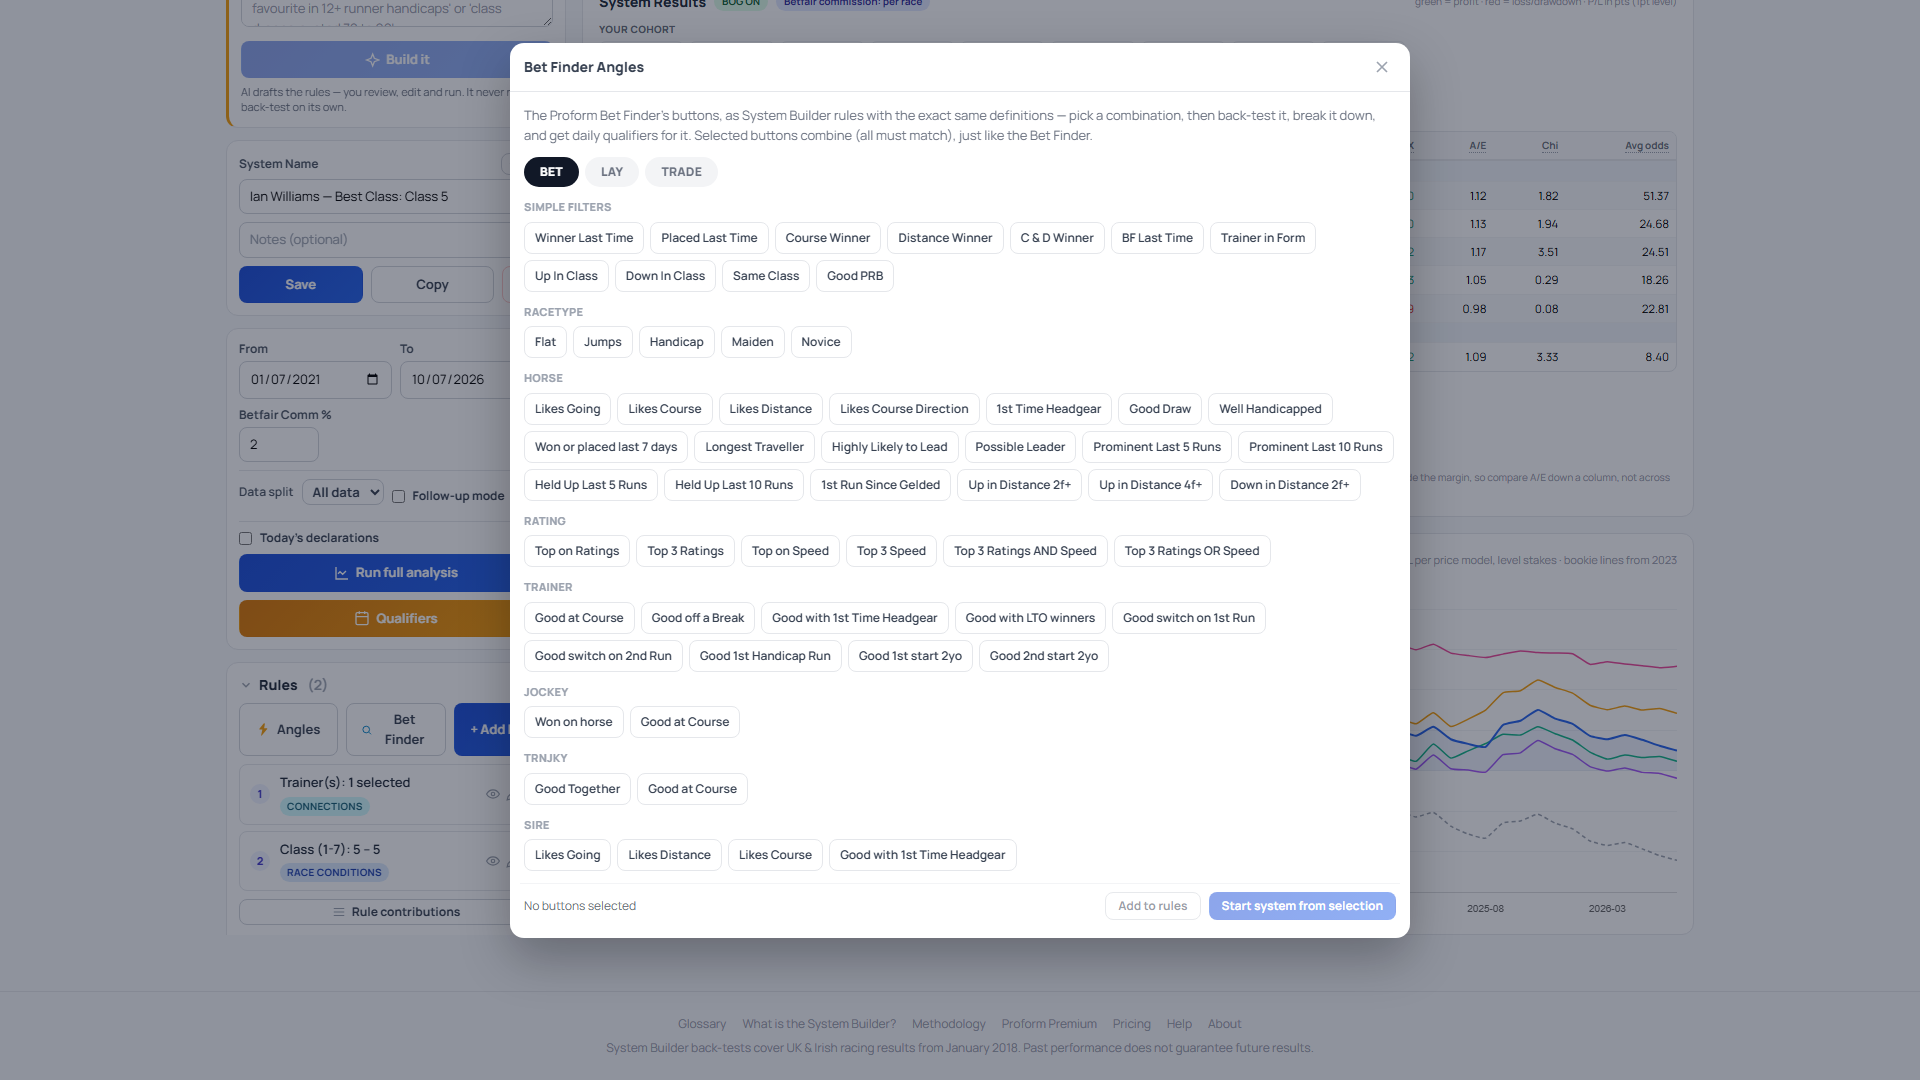
How to use it. Pick a tab (Bet, Lay or Trade), tick one or more buttons, then either Add to rules (the buttons join whatever rules you already have) or Start system (a fresh system containing just those buttons). Ticking several buttons means a runner must satisfy all of them — the same as ticking several buttons on the Bet Finder. Every button shows a short note explaining precisely what it checks, so you never have to guess what "Likes Going" is really testing.
How the "Good / Bad" buttons decide. Most of the trainer, jockey and sire buttons are records judged by A/E — actual wins versus expected wins. Expected wins come from the odds: a runner at 3/1 is expected to win about a quarter of the time, so it contributes 0.25 of an expected win. Add that up over every qualifying run and compare it with the wins that actually arrived: above 1.0 means the record beats what the market expected (backing them all would have beaten the odds), below 1.0 means it falls short. The Bet Finder calls a record good when it shows an A/E of 1.1 or better with at least 5 expected wins (so a fluky small sample can't qualify), and bad at 0.7 or worse on the same sample guard — and those exact gates are what the buttons here apply. The odds used are the actual Betfair SP, which is the fairest yardstick because it carries no bookmaker margin.
Where it can differ from the Bet Finder page — read once. Three honest caveats. First, the site's results database starts in 2018, while the desktop Bet Finder reaches back further — so for long-standing sires (the "Sire Likes Going / Distance" buttons) a record sitting right on a gate can qualify on one and not the other. Second, the ratings-rank buttons (Top Rated, Top 3, NOT in Top 5…) use live, current ratings, whereas the Bet Finder page is generated up to two days before racing — ours are fresher, so the odd runner can differ near the cut-off. Third, a couple of buttons are close analogues rather than clones: Good/Bad Draw uses the point-in-time Draw Bias A/E with the Bet Finder's thresholds, and Trainer in/out of Form currently judges the 14-day record against the standard SP rather than Betfair SP. Everything else is the Bet Finder's own definition, validated runner by runner against its daily files.
A good first workflow: open the Lay tab, tick Unplaced Last Time + Trainer Out of Form, press Start system and run it. Then open the breakdowns and see where the angle actually earns — that is the step the Bet Finder page can't do for you.
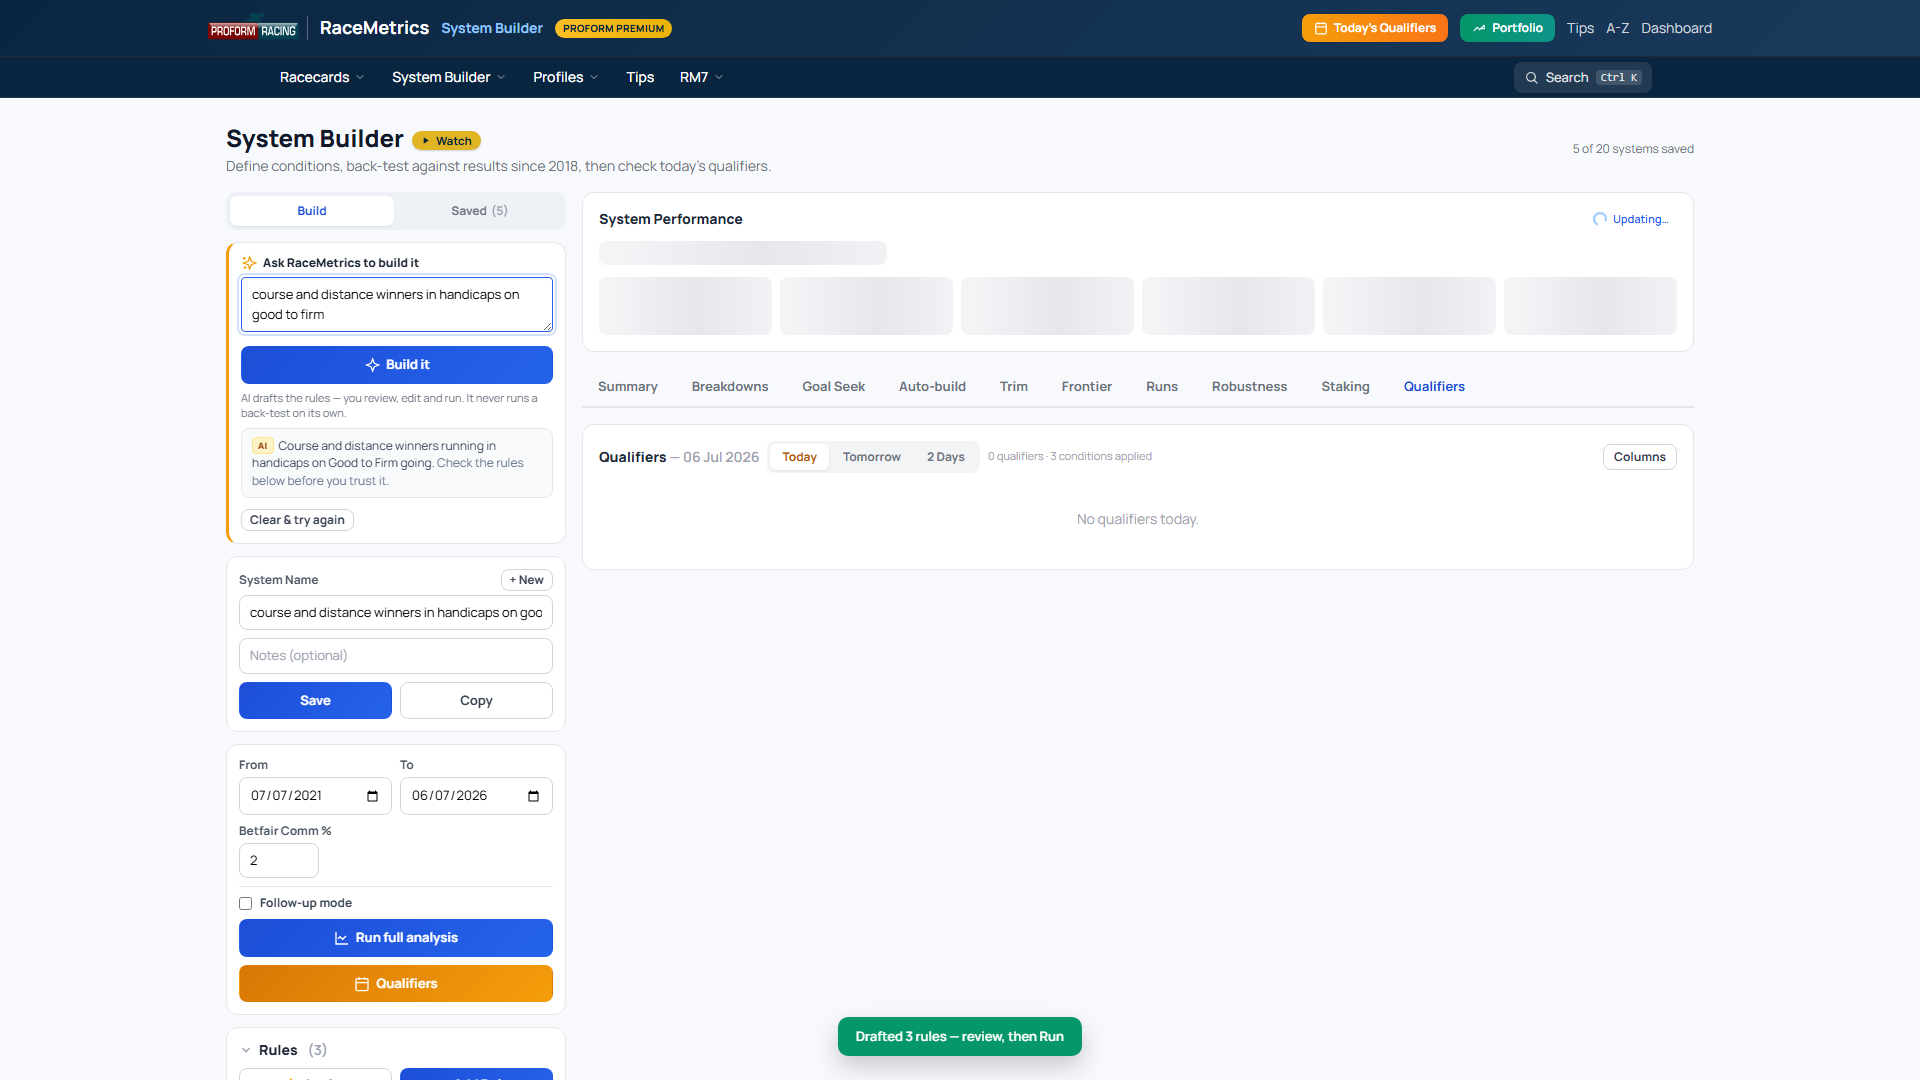
Don't want to pick fields by hand? At the top of the builder there's an Ask RaceMetrics to build it box. Describe the system you want in plain English — "class droppers rated 70 to 90", "lay the favourite in 12+ runner handicaps", "first-time headgear in maiden hurdles", "top-rated on the RaceMetrics score and 10 points clear" — and it drafts the matching rules for you.
It speaks racing
It understands the language you'd actually use — "front runners", "beaten favourites", "dropping in class", "off a break", "first-time cheekpieces", "gelded first time", "fillies", "big fields", "steamers", "top-rated on RaceMetrics and clear" — and maps each to the right filter. If it asks to "break it down by course / by month / by price", it flags that too, so you know which breakdown to open after you Run.
It drafts, you decide
The Ask box never runs a back-test on its own. It reads your question, builds the rules, and loads them into the builder exactly as if you'd added them by hand — fully editable. You review them, change anything you like, then click Run yourself. Treat it as a fast first draft, not an oracle: always glance over the rules it built before you trust the numbers.
Back, lay and each-way
Ask for a system as a bet — "lay the favourite in 12-runner handicaps", "back the second favourite on soft ground" — and it splits the sentence for you: the selection becomes a rule (the favourite, the second favourite, and so on), and the side appears as a short "Set these on the Staking tab" note. That's because Back, Lay, Lay the Place and Each-Way aren't filters — they're how you bet the runners a system finds, chosen on the Staking tab after you Run. Note that "12-runner handicaps" is read literally as exactly twelve; say "12 or more runners" if you want the wider field.
When it can't express something
The builder filters one runner at a time, so a few kinds of question can't be turned into rules — anything that compares runners to each other or describes the shape of the race. "Only one horse in the race is a front-runner", "the favourite's run style", "the going came up softer than forecast" — there simply are no fields for these. When your question includes something like that, the Ask box tells you plainly in an amber "I couldn't express these" panel rather than quietly guessing and handing you a system that means something different from what you asked. Add those parts by hand, or reword the question.
Then pivot for free
Once the rules are loaded you get everything the builder offers at no extra cost — every breakdown, all ten staking plans, Goal Seek, Qualifiers. Build the cohort once with a sentence, then slice it every way you like — no need to re-ask.
Most systems back a horse in the race that matches your rules. But some of racing's best angles are about what a horse does next — the eye-catching run that says "follow me next time". Follow-up mode flips the builder around: your conditions define the qualifying run, and the system backs that horse's next starts instead of the qualifying race itself.

How it works
- Build your rules as normal — but read them as a description of the run that earns a horse a follow, not the bet. "Beaten favourite, finished second, big field" is a classic qualifying run.
- Tick Follow-up mode (settings panel, just below the Data split selector). Two options appear: Back the next N starts (one to six, default three) and Stop at a win (on by default — the chain ends the first time the horse wins; that winning run is still counted as a bet).
- Run it — the System Performance panel turns amber with a "Follow-up · next N" badge, and the caption spells out the shape: roughly how many qualifying runs produced how many follow-up bets.
- Every follow-up run is counted once, even when a horse qualifies twice in quick succession and the chains overlap — no double-counting.
What it's for
It answers the question the ordinary back-test can't: do horses that run like this pay to follow afterwards? Eye-catchers (staying on late over an inadequate trip), unlucky beaten favourites, fast-ground winners switched to soft — build the trigger, then measure whether the market underestimates them next time, and for how many starts the edge lasts before it fades.
Things to know
- Follow-up mode is summary-only. Breakdowns, staking, the runs list, robustness and qualifiers all bet the qualifying race, so they don't apply and are paused while it's on — you get the headline back-test of the follow-up bets.
- Goal Seek, Auto-build, Trim and Frontier sit it out for the same reason.
- It can't combine with Today's declarations (both redefine what gets bet) — switching one on turns the other off.
- Prices are the follow-up runs' own Betfair SP — you're measuring the real cost of following, not the qualifying day's market.
Sometimes the question isn't "does this system make money?" but "which of today's runners fit it?" — say, it's Good To Firm everywhere and you want each of today's horses' record on that ground. That's what the Today's declarations switch (in the settings panel, under Follow-up mode) does.
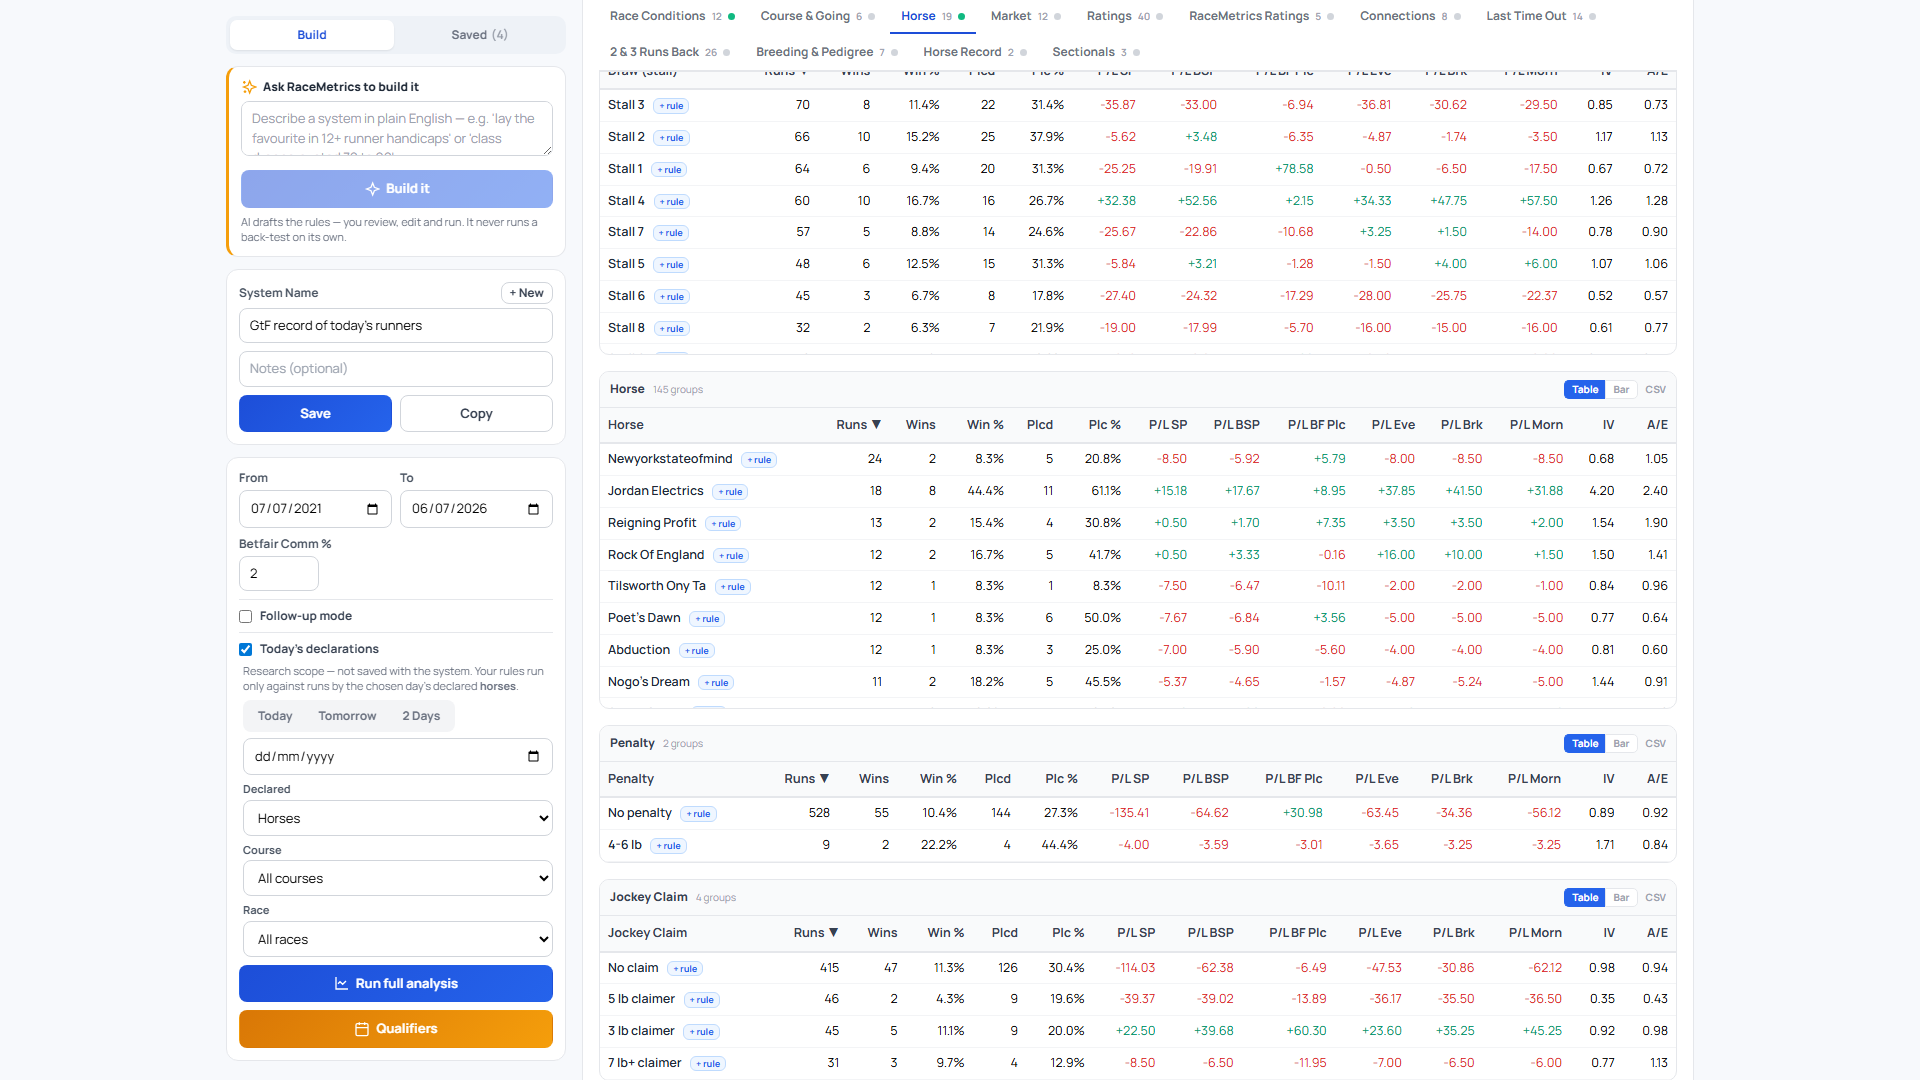
How it works
- Pick a day — Today, Tomorrow, 2 Days, or any date from the calendar (past days research that day's card).
- Pick what's declared — Horses, Trainers, Jockeys, Trainer & Jockey combo, Sires, Dams or Damsires. Your rules then run only against the historical runs of the connections declared that day.
- Optionally narrow to one course or one race from the day's card.
- Run — and the builder lands straight on the matching breakdown: one row per declared horse (or trainer, sire…), each showing its whole record under your rules. Click a row for the actual runs behind it; + rule follows that connection in the system.
The classic use: rules = official going Good To Firm, declared = Horses, day = Today → a sortable table of today's runners' Good To Firm records. Sort by A/E or Win % and you've screened the whole card in one click. It works just as well the other way up: declared = Sires on soft-ground days, declared = Trainer & Jockey combo for booking angles, and so on.
Things to know
- It's a research lens, not part of the system. Saving the system does not save the scope — saved systems keep feeding Qualifiers and your live record from the full history.
- Goal Seek, Auto-build, Trim and Frontier pause while it's on. Tuning rules against one day's runners would just fit the day — that's over-fitting by design, so the tools sit this one out.
- It can't combine with Follow-up mode (both redefine what gets bet) — switching one on turns the other off.
- A horse scratched during the day can linger in cached results for a little while; the Qualifiers tab (which lists who matches your pre-race rules) is the live-card view.
- Leave the page open past midnight with "Today" selected and the numbers on screen still belong to yesterday's card — hit Run full analysis (or reload) and everything moves to the new day.
Building a system
A system is just a list of rules. A runner has to satisfy every active rule to qualify — rules are joined with "and", never "or". So each rule you add makes the system tighter (fewer runners, more specific). Removing one makes it looser.
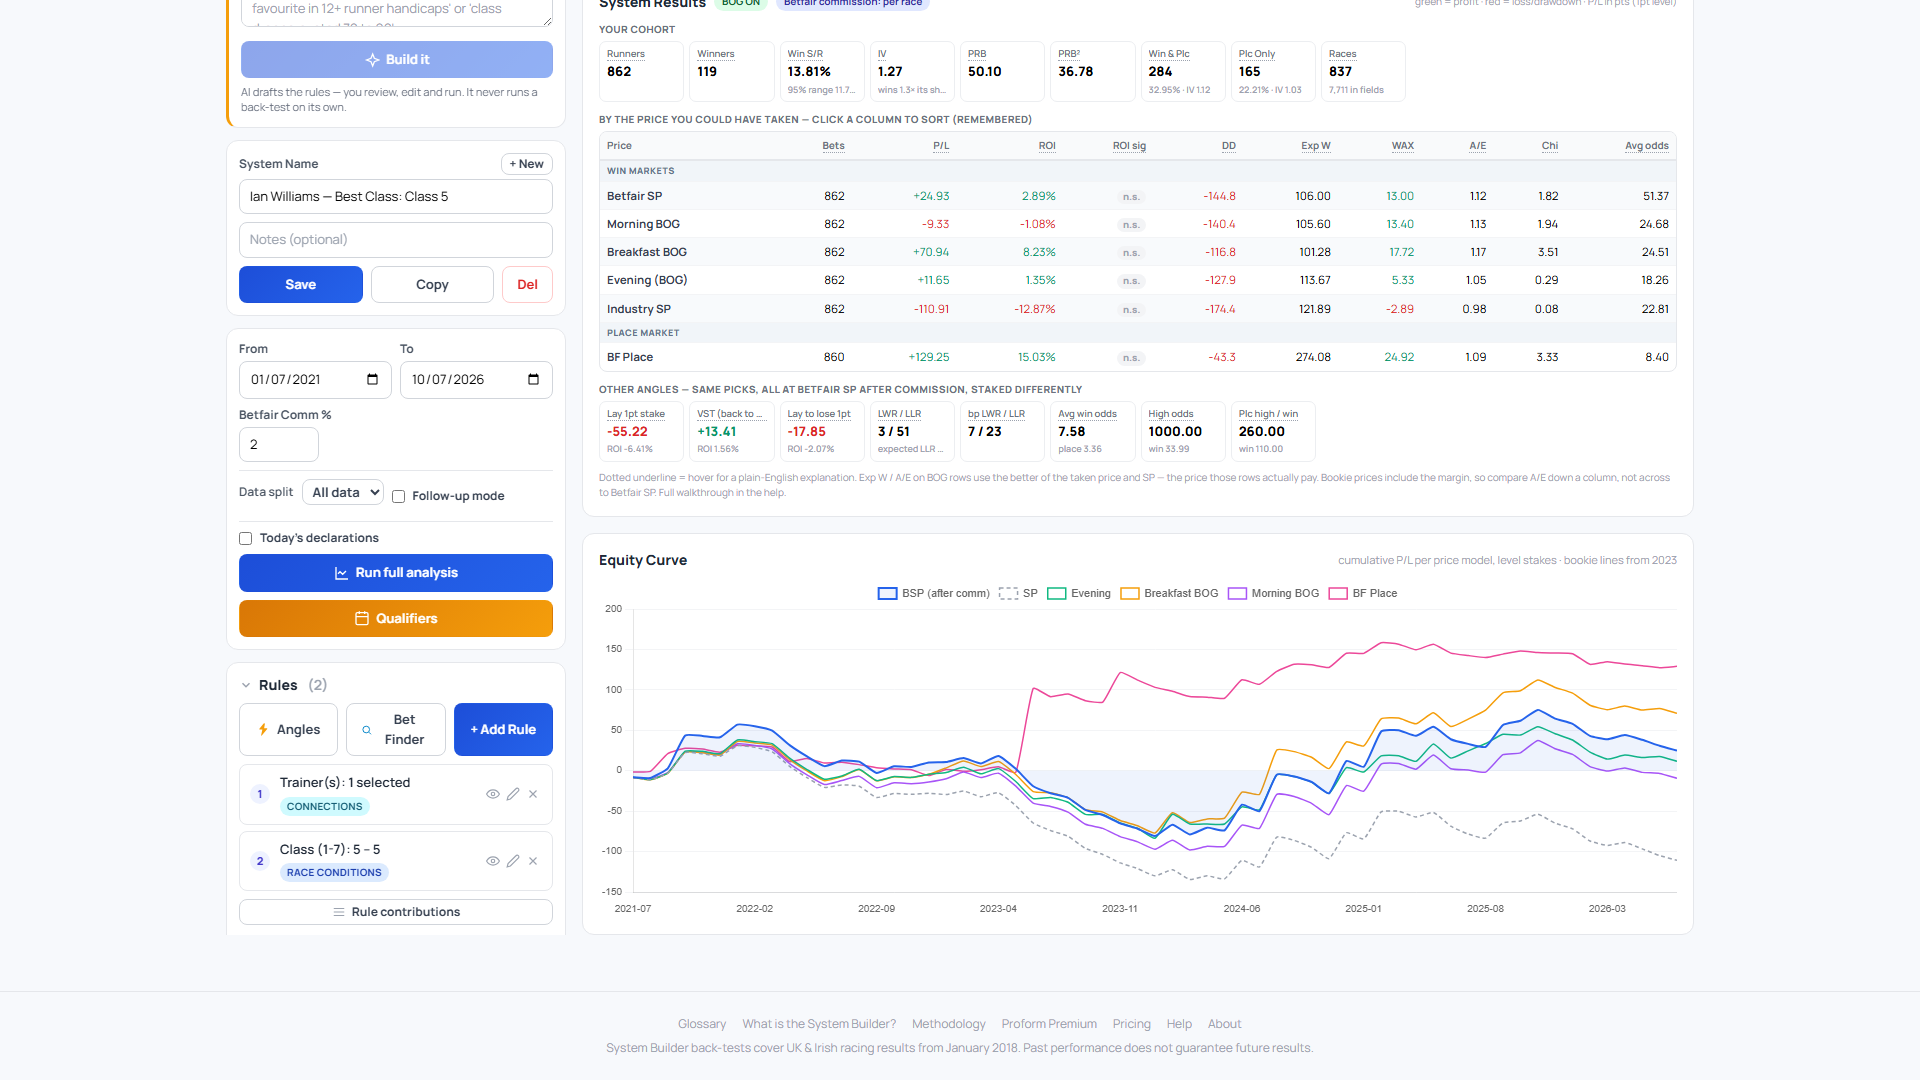
Finding a field
Click a category, or type in the Search filters box beside them, which looks across every category. It knows the everyday words for a field as well as its name, and the short forms field names use, such as Hcap for handicap and BSP for the Betfair Starting Price: betfair finds BSP Rank, handicap debut finds All Hcap Runs (career) (set it to equal 0, with Handicap set to Yes), and steamer, layoff and apprentice find the market move, the days since the last run and the jockey's claim.
Anatomy of a rule
Every rule has three parts: a field (what you're testing — class, age, trainer…), an operator (how you're testing it), and a value. The operators you'll meet:
- Is / Between — an exact value or a range (e.g. Class between 4 and 6).
- At least / At most — a minimum or a maximum (e.g. Field size at least 8).
- Is any of / Is none of — pick from a list to include, or to exclude (e.g. Going is any of Soft, Heavy).
- Contains / Does not contain — a text search (e.g. Race name contains "Novice"). Put several phrases in one rule by separating them with
|: containsran on | kept on | stayed onmatches a runner whose text has any of them, and does not contain keeps only runners whose text has none of them (up to 10 phrases). Use|, not a comma: in-running comments are full of commas ("led, ran on").
Three flavours of a rating: Value, Rank and "clear by"
Many rating fields come in three versions, and it's worth understanding the difference once:
- Value — the raw rating number (e.g. Official Rating ≥ 80).
- Rank — the runner's position within today's race on that rating, where 1 = top-rated. "Rank = 1" means the highest-rated horse in the field, whatever its actual number.
- Clear by — how many points the top-rated runner is clear of the next one. Pair "Rank = 1" with "clear by ≥ 5" to find a horse that's not just top-rated but clearly the best on paper.
Mute instead of delete
Every rule has a mute toggle (the eye icon). A muted rule stays in your system but is ignored by the back-test — perfect for asking "what does this one rule actually do for me?" without losing it. It pairs with the cockpit's contributions view.
As you build, the cockpit gives you instant feedback without running a full back-test, so you can feel your way to a good system.
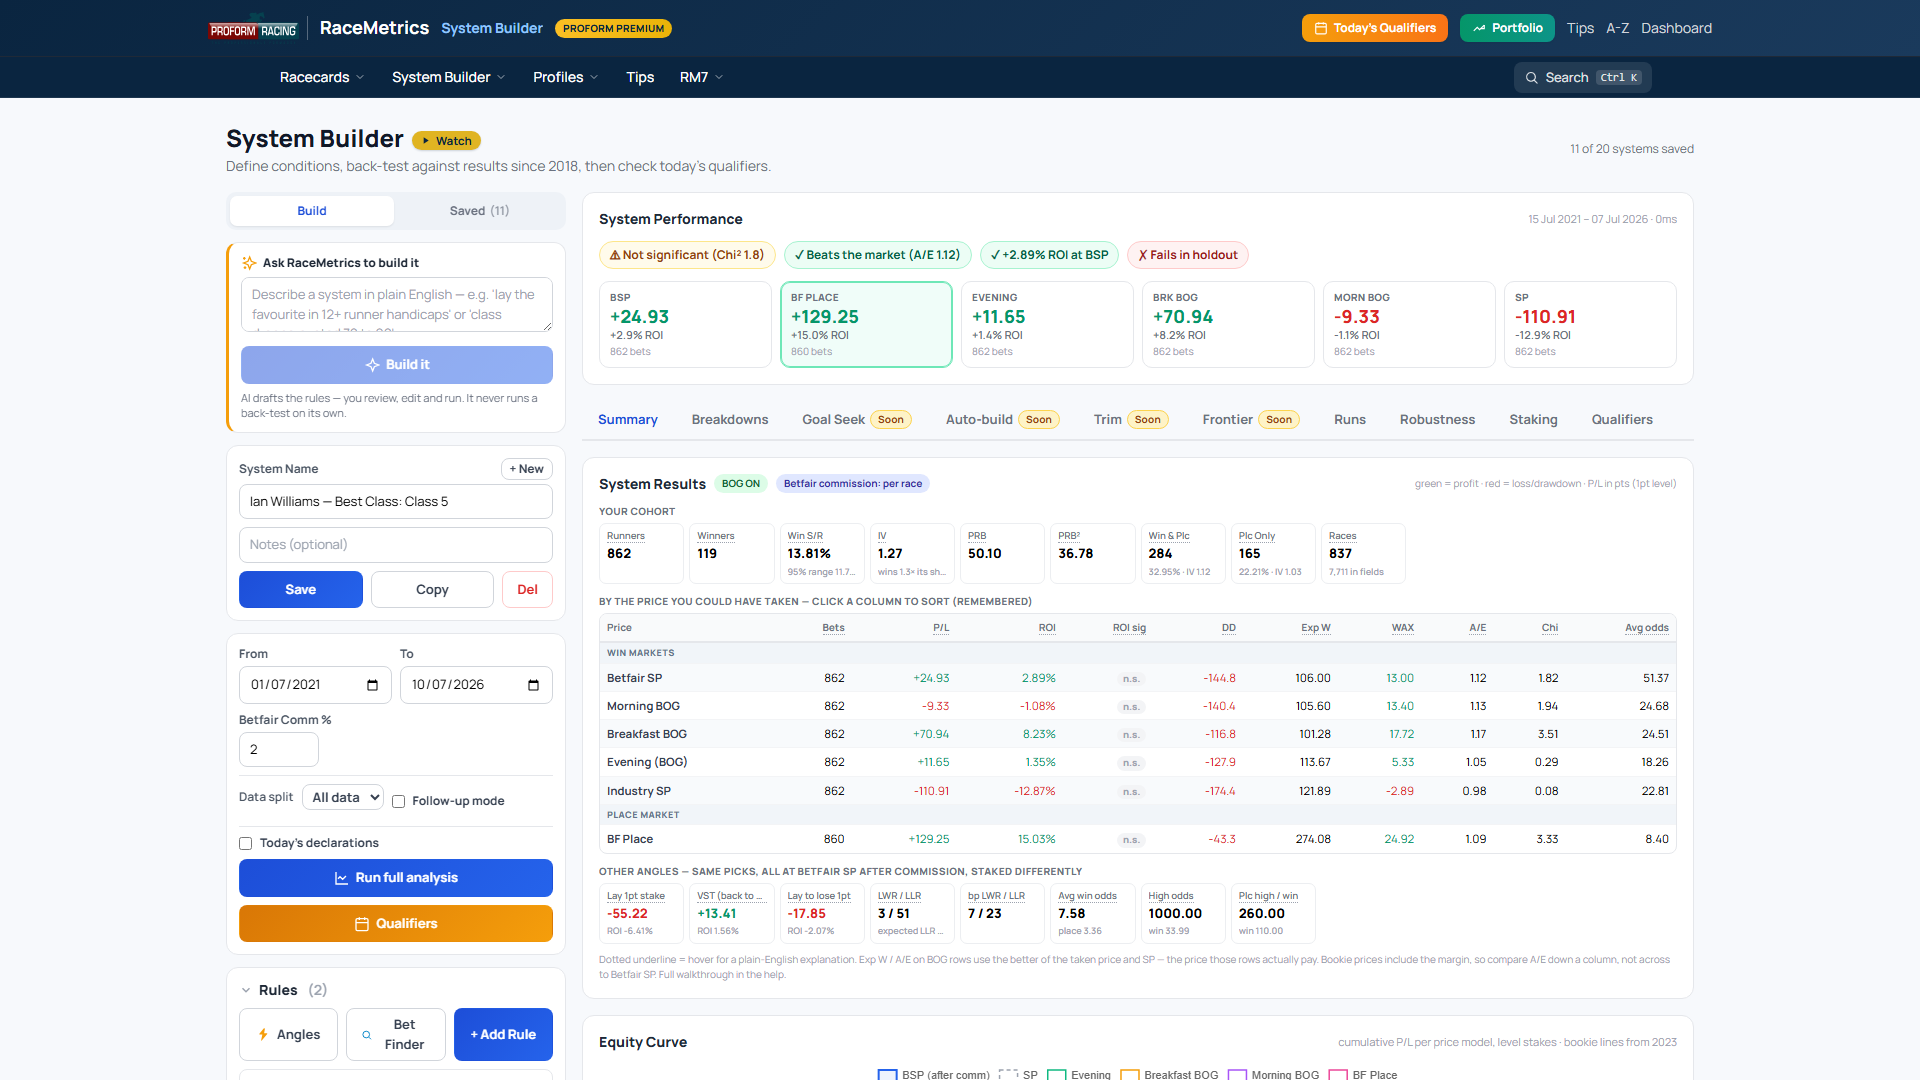
- Live count & headline — how many historical runners match, and a quick read on strike rate and return, updated as you edit.
- Per-rule contributions — the standout tool. For each rule it shows how many runs that rule excludes and what it does to your return. A rule that "cuts 40,000 runs, +6% ROI" is earning its keep; one that cuts a lot for no gain is dead weight. It's the manual version of Trim.
Filters reference
Race-condition filters describe the race itself — not the individual horse. They answer questions like "what grade of race is this?", "how far is it?", "what's the ground like?" and "how big is the field?". Reach for these when your idea is about a type of contest — for example "sprint handicaps on soft ground" or "big-field maidens in the autumn".
A quick bit of jargon first. A handicap is a race where the official handicapper gives each horse a weight to carry based on its ability, trying to give them all an equal chance — so form and weight matter enormously. Class is the quality tier of the race (Class 1 is the best, Class 7 the lowest). Going is the state of the ground, from firm/fast to soft/heavy. A furlong is one-eighth of a mile (8 furlongs = 1 mile). The field size is how many horses ran.
Where & what kind of race
- Course — pick one or more racecourses (e.g. Ascot, Newmarket). "Is any of" includes only those tracks; "Is none of" excludes them. Use this to focus on a course you know well, or to strip out a track you don't trust.
- Race Type — the code of racing:
Turf(flat on grass),A/W(flat on an all-weather/synthetic surface),Chase(jumps over fences),Hurdle(jumps over hurdles), orNHF(National Hunt Flat, a.k.a. "bumper" — a flat race for jumps horses). You'd use this to keep a system to, say, jumps only. - Surface — narrows the ground type to
Turfor a specific all-weather surface:Polytrack,TapetaorLaytown(Laytown is the unique sand-beach course in Ireland). Tip: for any all-weather track, just use Race Type = A/W instead — Surface is for when the exact synthetic matters.
Grade & classification
- Class (1-7) — the numeric quality band, where 1 is the highest grade and 7 the lowest. You can match a single class, a list, or a range ("between"). Example: set 1 to 3 for top-tier racing only.
- Class Letter — the same quality idea expressed as letters,
Class A(highest) throughClass H. An older lettering scheme; pick whichever you're more comfortable reading. - Classification (any of) — the descriptive labels a race carries. A single race can hold several at once (e.g. a "Listed Fillies" race), so this matches if the race has any of the ones you tick. Options include
Handicap,Maiden,Novice,Selling,Claiming,Classified,Nursery,Conditions,Auction,Apprentice Riders,Amateur Riders,Conditional Jockeys,Rated Stakes,Fillies,Mares,Juvenile,Median Auction,Showcase,EBF,Group 1/2/3,Grade 1/2/3,ListedandHunters Chase. (A maiden is for horses that have never won; a nursery is a handicap for 2-year-olds; Group/Grade/Listed are the elite races.) Ticking two or more means or, not and, soHandicap+Novice+Filliesfinds a race that is any one of the three. That is whyHandicapappears here as well as in its own Yes/No filter: use the Yes/No one when every qualifier must be a handicap (it is also the only way to exclude handicaps), and tick it in this list when you want handicaps or something else. Use this to target, say, all maidens. - Classification (none of) — the exact opposite: excludes any race carrying the labels you tick. Handy for removing low-grade selling/claiming races from a system.
- Pattern / Listed Race — a Yes/No shortcut for the very best races: any
Group 1-3,Grade 1-3orListedcontest. Yes = elite races only. - Maiden / Novice — a Yes/No shortcut for the two beginner grades (maidens and novices), where horses are still relatively unexposed.
- Seller / Claimer — a Yes/No shortcut for selling and claiming races (the lowest grades, where horses can be bought out of the race).
- Race Name — a free-text search of the race title. "Contains" matches a word you type, "Does not contain" excludes it. Examples given:
Maiden,Novice,Listed. Useful when a label you want isn't a tidy classification tick-box.
Handicap status
- Handicap — a Yes/No switch.
Yes= handicaps only;No= exclude handicaps. One of the most-used filters, because handicaps and non-handicaps behave very differently. - Handicap Rating Limit — the upper Official Rating ceiling of a handicap (for example a "0-90" handicap has a limit of 90). Set a range to target a band of handicap quality. Non-handicaps don't have a limit, so they won't match this.
- Race Average Official Rating — the average official rating of the runners in the race, to one decimal place. Class is a broad band: inside one class the average can move a long way (a strong Class 5 can be stronger than a weak Class 4), so this is a finer measure of how good a race is. Only runners with a rating count, and races with fewer than three are left out. On today's and tomorrow's cards it averages the runners still in, so a withdrawal changes it straight away. The Race Average Official Rating breakdown splits results into ten-point bands.
Distance, field size & prize money
- Distance (furlongs) — how far the race is run, from 4 to 40 furlongs, set as a range or a minimum/maximum. (Note: it uses truncated furlongs — spare yards are dropped — to match the Form Expert tool.) Example: 5 to 6 furlongs for sprints.
- Distance (yards) — the exact race distance in yards (1 furlong = 220y), for finite control the whole-furlong filters can't give: e.g. between 1,100 and 1,320 catches everything from bare 5f up to exactly 6f.
- Distance to Nearest Furlong — the distance rounded to the nearest furlong: anything within 110 yards either side counts as that furlong, so "6f" means 5f 111y through 6f 110y — the 6f area. Contrast the plain Distance filter, which truncates (6f 219y still counts as 6f there).
- Field Size — the number of runners (1 to 60). Set a minimum to avoid tiny fields, or a maximum to focus on small, easier-to-read races. Example: 8+ runners.
- Race Value (£) — the race's total advertised prize fund, shared out across the placed horses. This is the figure quoted in the racing press and shown on the racecards menu, and it is the best rough proxy for how important and competitive a race is — bigger fund, better horses. Set a minimum to chase the better races.
- Winner's Prize (£) — first prize only: what the winner actually collects, which is roughly 55% of the total fund. It is a stricter filter than Race Value at the same number — asking for a £25,000 winner's prize lands you races worth well over £100,000 on average. Use Race Value unless you specifically mean the winner's cheque.
Age limits the race is open to
These describe the age band the race is restricted to (not the individual horse's age — that's in the Horse filters).
- Race Lower Age Limit — the minimum age the race admits (e.g. 3 means open to 3-year-olds and upwards).
- Race Upper Age Limit — the maximum age (e.g. 2 means a 2-year-olds-only race). Open-age races, which anything aged 3 and over can enter, have no upper limit.
- Open-Age Race (no upper limit) — a simple Yes/No: set it to Yes to keep only open-age races (the desktop builder's "OPEN"), where 3-year-olds and older horses run together. This is how you exclude 3-year-olds-only races from an all-aged handicap system — the numeric Upper Age Limit can't do it, because open-age races store no maximum to compare against.
Ground softness & the going
- Official Going — the ground description for the race. "Is any of" includes the conditions you tick; "Is none of" excludes them. The scale runs firm-to-soft:
Hard,Firm,Fast,Good To Firm,Good,Good To Soft,Soft,Heavy, plus the all-weather settingsStandardandSlow. This is the official/forecast going (the going as called before the race). - Going Adjustment (GA) — Proform's own ground-softness number, measured after the race (so it's a post-race fact). Negative values mean soft/heavy ground, around 0 means good/standard, and positive means firm/fast. Use it for a more precise "how soft was it really" filter than the word-label going. Range -40 to +25.
Non-runners (withdrawals)
A non-runner is a horse that was declared but then withdrawn before the off. Withdrawals trigger "Rule 4" deductions, which distort the prices of the horses left in — so these filters help you isolate or study that.
- Race Had a Non-Runner — Yes/No.
Yes= at least one horse was withdrawn (Rule-4 territory); pair withNoto isolate clean races with no price distortion. - Non-Runner Count — exactly how many declared horses were pulled out (0 = none). The more non-runners, the more Rule-4 price distortion there was. Set a range or a threshold.
- Rule 4 on Evening / Breakfast / Morning Price (p) — the Rule 4 deduction, in pence in the pound, on a bet struck at that price: set by the prices of the horses withdrawn after it was taken, never more than 90p (0 = none). Recorded from August 2018. Use it to see how much of a system’s early-price return came from races that lost a fancied runner late, or set it to 0 to leave those races out.
- Dead Heat for Win — Yes/No.
Yes= two or more horses dead-heated for first, so a winning bet paid part of the stake.
How exposed the field is
- % First-Time Starters in Race — the percentage of the field making their racecourse debut (0-100%). A high number flags an unexposed, hard-to-read race (typical of early-season 2yo maidens).
- % of Field Won LTO — the percentage of runners that won their last time out ("LTO" = the horse's previous race). A high figure means a field full of in-form, last-day winners — often a competitive, well-backed race.
When the race was run
Calendar filters for seasonal or day-of-week angles.
- Day of Week — pick one or more of
MondaythroughSunday. - Month — pick one or more calendar months,
JanuarytoDecember. - Date in Year (dd/mm to dd/mm) — the same calendar window in every year. This is the filter for festivals that straddle two months, which Month alone cannot express. Set a from and a to date and the window repeats each season, so a meeting like Glorious Goodwood stays in one dataset instead of two. One-click presets are built in for the awkward ones. The window may also wrap the year end (
26 Decto3 Jan) to capture the Christmas meetings in a single set. Always pair it with the Course filter — the window is a date range, not a meeting name. - Season — grouped months:
Spring (Mar-May),Summer (Jun-Aug),Autumn (Sep-Nov),Winter (Dec-Feb). - Weekend — a Yes/No shortcut for Saturday or Sunday racing (typically bigger, more competitive cards).
- Year — the calendar year of the race (2018 onwards). Match a single year, a list (comma-separated), or a range — useful for checking whether an angle still worked recently.
- Week Number (Mon-Sun) — the Monday-to-Sunday week of the year, 1 to 53. It is the standard ISO week number, the same figure the ISOWEEKNUM function gives in Excel, so it lines up with any spreadsheet work you already do. Match a single week, a list (comma-separated) or a range — weeks 20 to 30 for high summer, say. Week 1 is the week holding the first Thursday of January, which means a race on 1 or 2 January can land in week 52 or 53 of the year before.
Studying a festival that spans two months
Some of the meetings most worth studying refuse to sit inside one calendar month, and the fixture list shifts by a few days each year. Before, that meant building two datasets and adding the results up by hand. Date in Year replaces both with a single window that repeats every season.
- Glorious Goodwood — 26 Jul to 5 Aug. The festival has started as early as 26 July (2022) and as late as 1 August (2023), so a fixed month never captures it. This window holds every festival race across the last five runnings and, importantly, excludes Goodwood's separate late-August fixture, which is a much weaker meeting and would otherwise dilute the sample. Add Course = Goodwood alongside it.
- Punchestown Festival — 25 Apr to 4 May. The same problem in reverse: the meeting has run entirely within April (2022, 2023) and has also spilled into May (2024, 2025). Pair it with Course = Punchestown. Note the later May fixtures at the track fall outside the window by design.
- Galway Festival — 24 Jul to 7 Aug, another that regularly crosses the month end.
- Christmas & New Year — 26 Dec to 3 Jan, which wraps the year end. The filter handles this correctly: it selects late December or early January rather than everything in between.
These filters describe the racecourse and the ground in a bit more depth than the basic Race-condition filters. Some courses run clockwise, some anti-clockwise; some are flat and galloping, others tight and undulating; and the ground that's actually returned after the race can differ from the going that was forecast beforehand. Reach for these when your idea is about a kind of track — for example "galloping left-handed courses" — or when you want the ground reading that the race actually produced.
Shape and location of the track
- Course Direction — which way the track turns:
Left-handed(anti-clockwise) orRight-handed(clockwise). Some horses are markedly better one way round, so this is a common pairing with a horse or trainer filter. Known before the race. - Course Country — the nation the racecourse is in:
Great Britain(GB),Ireland(IRE),Northern Ireland, orUAE. Use it to keep a system to British racing only, or to add Irish meetings. Known before the race. - Course Nation — the finer cut of Course Country, splitting Britain into
England,ScotlandandWales, alongsideIrelandandUAE. Course Country cannot separate the British nations — all 61 British tracks share one "(GB)" — so reach for this when the idea is about a nation rather than the whole of Britain, such as Scottish jumps tracks or the three Welsh courses.Irelandcovers the whole island, Northern Ireland included, because Irish racing is a single jurisdiction; use Course Country if you want Down Royal and Downpatrick on their own. Known before the race. - Course Characteristics — the physical shape of the track. Tick any of
Galloping(long, sweeping, suits big-striding horses),Sharp(tight, favours nimble types),Stiff(a demanding, often uphill finish),Undulating(up-and-down terrain), orEasy. Some courses carry more than one tag (e.g. "Sharp / Undulating"), and this matches each tag — so tickingSharpwill catch a "Sharp / Undulating" track. You'd use this to find, say, all stiff galloping tracks that suit a relentless galloper.
The course and trip being run (from the course maps)
Course Characteristics gives one word for a whole course. These rules describe the ground the race is actually run over, trip by trip on the Flat and course by course over jumps, taken from Proform's course maps. From Proform's course maps; a race the maps cannot place (some Curragh trips, Listowel's jumps races, a trip with no map within half a furlong) matches none of these. All are known before the race.
- Course Layout — which course is used where a racecourse has more than one:
Cheltenham Old course(October, November and the first two days of the Festival) orCheltenham New course, Aintree'sGrand National courseorMildmay course, Newmarket'sRowley MileorJuly course(June to August), the round mile at Ascot and Doncaster, the Curragh straight and Kempton's inner loop. - Track Type (course and trip) — how the track rides over this trip:
Very Sharp,Sharp,Easy,GallopingorStiff. Lingfield's straight turf trips ride Galloping, its round turf trips Easy. - Direction (course and trip) — which way this trip turns:
Left-handed,Right-handed,Straight(no bend at all) orBoth ways(Fontwell's figure-of-eight chase course and a few Flat trips). Course Direction gives the whole course; this one knows a 6f on a straight course is straight. - Gradient (course and trip) / Gradient Profile — the lie of the land in six groups (
Level,Undulating,Uphill,Downhill,Down then uphill,Up then downhill), or the full wording from the map, such asSlightly Undulating Uphill. - Number of Bends (Flat trip) — 0 is a straight course.
- Distance to First Bend (yards, Flat) — how far from the stalls to the first bend (0 = the start is on the bend). A short run makes the draw and early pace count.
- Rise or Fall, Start to Finish (ft, Flat) — how much higher (+) or lower (-) the winning post is than the start: Epsom's 7f falls 80ft, Ascot's straight mile climbs 64ft.
- Height Range (ft) — lowest to highest point: over the trip on the Flat, over the whole course for jumps races.
- Home Straight (yards, jumps) / Climb in Home Straight (ft, jumps) / Circumference (miles, jumps) / Finish (jumps) — the jumps course's run to the line: how long the straight is, how much it climbs (Carlisle 52ft), how far round the course is (Fakenham under a mile, Cheltenham over two and a half) and how it finishes, from
LeveltoVery Uphill.
The ground that actually came up
- Actual Going (post-race) — the going returned after the race, as opposed to the official/forecast going used in the Race-condition filters. The scale is the same firm-to-soft range —
Hard,Firm,Fast,Good To Firm,Good,Good To Soft,Soft,Heavy, plus all-weatherStandardandSlow. Because it's only known after the race has been run, it's a post-race fact, so it's best for back-testing how a system performed on the ground that genuinely materialised rather than what was predicted.
The Horse filters describe the individual runner standing in the parade ring — not the race around it, and not its trainer or jockey (those live in their own groups). Reach for these when your idea is about the animal itself: its age, sex and colour, the weight it carries, where it's drawn, the headgear it's wearing, how long it's been off, and — most powerfully — its own track record at today's course, distance, going and class.
A quick word on two phrases that crop up throughout. A "strike rate" (SR) is simply the percentage of runs that were wins. "PRB" stands for Percentage of Rivals Beaten — a fairer measure of consistency than win/lose, because a horse that finishes 2nd of 12 has still beaten 10 rivals (about 91%) even though it didn't win. "A/E" (Actual over Expected) compares how often something actually wins against how often the betting market expected it to win: 1.0 is bang in line with the market, above 1.0 means it wins more than its odds suggest (i.e. it's been good value), below 1.0 means it under-delivers. "SP" is the Starting Price (the official odds at the off), and "LTO" means Last Time Out (the horse's most recent run).
Identity — who the horse is
- Horse(s) — Type to search and follow one specific horse, or a list of horses. "Is none of" lets you exclude named horses instead. Useful for tracking your own shortlist, or for excluding a horse you never want to back.
- Age — The horse's age in years (2 to 20). You'd use this to, say, target 3-year-olds in early-season handicaps, or restrict a jumps system to seasoned 7yo+ chasers.
- Sex — The horse's sex: Gelding (a castrated male), Filly (young female), Mare (older female), Colt (young entire male), Horse (entire) (older entire male) or Rig. Handy for fillies-and-mares angles, or for filtering to geldings only.
- Colour — The horse's coat colour: Bay, Chestnut, Grey, Brown, Black or Roan. Most often used for the well-known "grey horse" curiosity systems.
- Gelding — A simple Yes/No: is the horse a gelding? (A shortcut for Sex = Gelding.)
- First Time Gelded — Yes means the horse has been gelded since its last run (it was not a gelding LTO). First-time geldings often improve. Horses on their debut are excluded, since there's no "last run" to compare against.
Weight, draw & travel
- Weight (lbs) — The total weight the horse carries, in pounds (80–200). In handicaps, better horses carry more.
- Weight Rank — Where the horse's weight ranks in the field, with 1 = top weight (carries the most). Ranked from the allotted weight, so jockey claims and late non-runners can shuffle it slightly at the off. Use this to back top-weights (often the best horse) or to find well-treated bottom-weights.
- Jockey Claim (lbs) — The weight allowance an inexperienced jockey "claims" (is let off carrying). 0 = an established rider with no claim; 3, 5 or 7 = an apprentice (flat) or conditional (jumps) rider. A 7lb claimer on a well-handicapped horse can be a real edge.
- Penalty (lbs) — Extra weight (0–20 lbs) a horse must carry as a penalty for a recent win, on top of its base weight.
- Weight Change vs LTO (lbs) — Today's weight minus last time out's. Negative = carrying less than last time (often a positive — an easier task). For example, set this to a negative range to find horses dropping weight after a defeat.
- Draw — The stalls number the horse breaks from in a flat race (1–40). Known at declaration, so it works for finding qualifiers. Jumps runners have no draw, so this naturally excludes them. Pair with a course where a high or low draw is known to be an advantage.
- Draw Bias A/E — A clever, pre-computed signal: it takes the A/E (value-versus-market measure) of this runner's third of the stalls (low/middle/high) at today's course and distance band, over the previous 5 years. Above 1 means this part of the stalls has historically been the favoured section. Flat racing only.
- Draw Group (low/high half) — Simply which half of the stalls the runner breaks from, split at the middle of today’s field. Flat only.
Draw & Pace — the racecard figures, now testable
These are the Drw IV, Pace IV, Tac and Mtx IV columns from the racecard’s Draw & Pace tab, using the same numbers and the same names — so an idea you spot on a card can be tested here without translating anything.
- Draw IV — How this exact stall has performed at today’s course, race type and trip over the previous five years. Above 1 = the stall wins more than its fair share. Flat only, and computed strictly from racing before the race, so it is safe for back-testing and for today’s qualifiers alike.
- Usual Run Style — Whether the horse habitually Led, raced Prominent or was Held up, taken from its last 10 runs and weighted towards the most recent. This is a description of habit, not a promise about today — a jockey can always change tactics — but it is known before the race, so it works for finding qualifiers.
- Run-Style Sample (runs) — How many past runs those pace figures rest on (0–10). Use this. About 7% of flat runners have no run-style history at all and another 19% have only one to three runs, so a Pace IV can look decisive when it is built on almost nothing. Setting a minimum of 4 or more is the single most useful habit with these fields.
- % of Runs Led / Prominent / Held Up — The full split behind the headline style, recency-weighted, so they add to about 100. A horse at 62% led and 29% held up is a different proposition from one that led in all ten.
- Run-Style Consistency % — The share held by the main style. Around 90+ is a confirmed front-runner or a confirmed hold-up horse; around 40 is a versatile type the jockey can place wherever the race demands.
- Pace IV — Whether the way this horse is usually ridden tends to win at today’s course and trip. It is blended: a horse that leads 38% of the time is credited with 38% of the Led figure, not all of it — so a versatile horse is never given a pure front-runner’s score. Built from its previous runs, so it works for upcoming races.
- Tactical Score — Draw IV and Pace IV combined into one number, weighted towards the draw at sprint trips (up to 7f, where the stalls matter most) and towards the pace beyond. Over jumps there is no draw, so it is the Pace IV on its own. Above 1 means both angles point the same way.
- Draw x Pace IV — The sharpest cut of the four, and the one worth reaching for first: do horses drawn in this half and ridden this way actually win here? It only counts past races with a field size near today’s, because a low draw in a 6-runner race is a different thing from a low draw in 16 — so it is deliberately blank where that sample is too thin. Flat only.
- In the Draw x Pace Sweet Spot — A simple Yes/No shortcut for Draw x Pace IV above 1.0.
A caution worth taking seriously. A strong Draw IV tells you the stall has won its share historically; it does not tell you the market has missed it. Test these against price and A/E before assuming an edge — and always pair a pace figure with its Run-Style Sample. There are matching breakdowns for every one of these fields, so you can see how each band has actually performed before you commit to a rule.
- Distance Travelled (miles) — How far the horse has come from its yard to today's course. A short trip can suggest a trainer fancies its chances at a local track; a long haul can be telling too.
Headgear & first-time aids
"Headgear" means equipment fitted to focus a horse or help its breathing. A change — especially first-time headgear — is a classic signal that the trainer is trying to spark improvement. There's one general filter plus a set of "first time" flags for each specific aid.
- Headgear — Matches the horse wearing any of the aids you tick: Blinkers (restrict side vision), Cheekpieces (sheepskin on the cheeks, milder than blinkers), Visor (blinkers with a slit), Hood (covers the ears to calm a horse), Tongue Strap (ties the tongue to aid breathing), Wind Surgery, or No Headgear. Compound codes (e.g. tongue-strap + something) count for both.
- First-Time Headgear — Yes when any headgear is being worn for the first time (the code carries a "1"). The broad version of the angle below.
The next group are the same idea applied to one specific aid — each is a simple Yes/No "worn for the first time":
- First-Time Blinkers — Blinkers on for the first time.
- First-Time Cheekpieces — Cheekpieces on for the first time.
- First-Time Visor — Visor on for the first time.
- First-Time Hood — Hood on for the first time.
- First-Time Tongue Strap — Tongue strap on for the first time.
- First Run After Wind Surgery — Yes for a horse's first run after a wind operation (breathing surgery, Proform's WS1 marker). A popular angle is to combine this with a younger age or a strong trainer to catch horses likely to improve for the op.
- Second Run After Wind Surgery / Third Run After Wind Surgery — the next two runs after the op (Proform's WS2 and WS3 markers; from the fourth run on the marker is a plain WS). Back-test the same system with each of the three in turn to see which run after the op does best. A second operation starts the count again at the first run.
Recent activity & days off
- Days Since Last Run — How many days since the horse last ran (0–3000). Low numbers mean a quick turnaround; very high numbers mean a long layoff or a return from injury. Use it to find fresh horses, or to avoid "ring-rusty" returners.
- Runs in Last 90 Days — How many times the horse has run in the past three months (0–30). A measure of how busy and race-fit it is right now.
Course / distance / going / class — the horse's own record
These tell you how well the horse has performed in conditions like today's, before today. They come in matched families, each with a few flavours of the same idea. The key dimensions are Course (today's track), Distance Band (today's trip), Going Group (today's ground conditions, grouped), Class (today's grade) and Career (everything combined).
Always pair a percentage with its matching "Runs" filter — a glittering 100% strike rate from a single run is meaningless, so set a minimum number of runs to demand a real sample.
Career win counts (total wins in specific conditions, counted strictly before today — the accurate, point-in-time basis behind the C/D/CD/BF racecard badges):
- Course Wins (career) — Total career wins at today's course, over any distance, before today. 0 means the horse has never won at this track — the filter for a course-specialist angle, or its lay-side "never won here". (Counts every course win — unlike the racecard C badge, which is hidden when the win was also over today's distance.)
- Distance Wins (career) — Total career wins at today's distance band, at any course, before today. 0 = has never won at this trip.
- Course & Distance Wins — Total career wins that came over both today's course and today's distance band, before today — strong evidence the horse goes well at exactly this venue and trip. 0 = has never won over this course & distance.
- Times Beaten Favourite — How many times the horse has been sent off favourite (or joint-favourite) and not won, before today. High counts can flag an unreliable favourite; 0 = never been a beaten favourite.
Runs & strike-rate pairs (number of past runs in each condition, and the win % from them):
- Horse Runs at Course / Horse SR % at Course — How many times it has run at today's track, and its win rate there.
- Horse Runs at Distance Band / Horse SR % at Distance Band — Runs and win rate at today's trip.
- Horse Runs on Going Group / Horse SR % on Going Group — Runs and win rate on today's type of ground.
- Horse Runs at Class / Horse Wins at Class / Horse SR % at Class — Runs, outright wins and win rate at today's grade (0 runs = first time at this class). Pair Horse Wins at Class with a minimum (say 1+) to demand a proven record at this level, rather than trusting a flattering percentage off a run or two.
- Horse Career Runs / Horse Career SR % — Total career runs (0 = a debutant) and overall career win rate.
PRB family — "% of rivals beaten", a smoother consistency measure than strike rate. There's a standard version and a PRB² ("PRB squared") version that is dominance-weighted — it rewards big, emphatic runs more heavily than narrow ones, so it leans towards horses that win/place with authority rather than just creeping into the frame.
Standard PRB (average % of rivals beaten in prior runs):
- Horse PRB % at Course — at today's course.
- Horse PRB % at Distance Band — at today's trip.
- Horse PRB % on Going Group — on today's ground.
- Horse PRB % at Class — at today's class.
- Horse Career PRB % — across its whole career.
Dominance-weighted PRB² (same five dimensions, squared to favour decisive performances):
- Horse PRB² at Course, Horse PRB² at Distance Band, Horse PRB² on Going Group, Horse PRB² at Class, and Horse Career PRB² — each the PRB² equivalent of the standard version above.
PRB for recent runs (in the Last Time Out category): LTO PRB %, 2nd-LTO PRB %, 3rd-LTO PRB % and 4th-LTO PRB % give the percent of rivals beaten in one named run (100 = won, 50 = mid-field, 0 = last or did not complete), and Average PRB % (Last 3 Runs) is the mean of the last three. They take the field size into account, which a finishing position does not: third of four is 33, third of twenty is 89.
Each has a breakdown table of its own. On the Breakdowns tab pick Horse Career PRB %, LTO PRB %, Average PRB % (Last 3 Runs), 2-Back PRB % or 3-Back PRB % to see your results in 10-point bands, with 100% on a row of its own. Read the IV column for who wins and the A/E column for whether the price already allows for it. Any of them can be one side of the Grid (LTO PRB % against LTO Field Size, for instance), and clicking a row adds that band as a rule.
Speed figures — how fast the horse has run
A "speed figure" (Proform's speed rating, shown as a code roughly 0–200) measures how fast a horse actually ran, adjusting for the ground and class. These filters look at the horse's speed figures before today, sliced by where and how it earned them. Two recurring shapes: Best (the single highest figure — peak ability) and Avg (the average figure — typical level). "This code" means today's race type (Turf / All-Weather / Chase / Hurdle / NHF).
- Horse Best Speed at Distance (code) / Horse Avg Speed at Distance (code) / Horse Median Speed at Distance (code) — Highest / average / median speed figure at today's distance band and race type. The Median version uses the middle value rather than the mean, so it's robust to one freak run skewing the picture.
- Horse Best Speed at Course (code) / Horse Avg Speed at Course (code) — Highest / average figure at today's course and race type.
- Horse Best Speed on Going Group (code) / Horse Avg Speed on Going Group (code) — Highest / average figure on today's going group and race type.
- Horse Best Speed (this code) / Horse Avg Speed (this code) — Highest / average career figure in today's race type overall.
Speed versus the par for the grade — these subtract the typical ("par") figure for the class from the horse's figure, so positive numbers mean the horse runs above the standard expected at that level:
- Horse Speed vs Class Par at Distance — Average of (speed figure − class par) at today's distance band and code. A positive value flags a horse running better than its grade demands.
- Horse Speed vs Class Par (this code) — The same idea across the whole of today's race type.
Recent form & trajectory:
- Horse Speed Last 90 Days (code) — Average speed figure over the last 90 days at today's race type — a read on its current form level rather than its career-best.
- Horse Speed Trend vs Career (code) — Recent (90-day) average speed figure minus the career average, at this code. Positive = improving, negative = declining. A neat way to catch a horse on the upgrade.
In-running & "ran better than it looked"
Sometimes a horse runs much better than its finishing position suggests — it travelled strongly and traded short in-running on the exchange before fading or being denied a clear run. These signals catch those hidden improvers, which a plain win/lose record would miss.
- Horse Ran-Well-In-Running % — The percentage of the horse's prior priced runs where its in-running low price came at least halfway in from its Betfair SP (i.e. it was travelling like a winner mid-race), or it actually won. A high value flags a horse repeatedly threatening without it always showing in the result.
- Horse Ran-Well Sample Runs — The number of prior priced runs the figure above is built from. Set a minimum here to make sure the Ran-Well % isn't drawn from a tiny sample.
- In-Running Comment — Searches the written in-running comment for this race, e.g. "led", "held up", "hampered". Post-race only — a research tool for past results, not for finding upcoming qualifiers.
- Run Style (post-race) — How the horse actually ran today: Led, Prominent or Held up. Recorded post-race, so research only. (For an upcoming-runner pace angle, use the LTO version in the Last Time Out group.)
Bet Finder angles — handicap marks, ride style, in-running record
These fields power the Proform Bet Finder's horse buttons, with the exact same definitions — so you can rebuild any Bet Finder angle here and back-test it properly. All are pre-race and work for today's qualifiers.
- Highest Winning Handicap OR — The highest Official Rating this horse has ever won a handicap off, in today's code (flat or jumps). Blank means it has never won a handicap.
- Lbs Below Highest Winning OR — That winning mark minus today's OR. 5+ means the horse is 5lbs or more below a mark it has already won off — the Bet Finder's "Well Handicapped" angle (pair with Handicap = Yes). −5 or less is its "NOT Well Handicapped" lay-side angle: the horse is now rated well above anything it has achieved.
- Jockey Has Won On Horse — Yes when today's declared jockey has ridden this horse to victory before. A proven partnership (the Bet Finder "Jockey Won on Horse" button).
- Jockey Rides On Horse (career) — how many times today's jockey has ridden this horse before today (counted as it stood on each race day, so back-tests never peek ahead).
0= the jockey's first time aboard;5+= an established partnership. Non-completions count as rides. - Jockey SR% On Horse — the jockey's win percentage over their previous rides on this horse. Only applies once they've ridden it at least once; combine with "Jockey Rides On Horse ≥ 3" (or more) to avoid one-ride 100%/0% noise.
- Horse Wins on Going Group — Career wins on today's type of ground. The Bet Finder's "Likes Going" is 2+ wins with a 15%+ strike rate (pair with the SR filter); "Dislikes Going" is 4+ runs with 9% or less.
- Course Runs (today's race type) / Course Wins (today's race type) / Course SR % (today's race type) — The horse's career record at today's course in today's race type (turf, all-weather, chase, hurdle or NHF) — a sharper cut than the any-code "Course Wins (career)" badge higher up the page. One win or more here is the Bet Finder's "Course Winner" definition, and the runs and strike-rate pair is the exact sample behind its "Likes/Dislikes Course" horse buttons. As always, pair the percentage with a minimum on the runs so one flattering visit can't mislead.
- Distance Wins (within 110y) — Career wins at a distance within 110 yards (half a furlong) of today's trip, at any course — the exact record behind the Bet Finder's "Distance Winner" button.
- C&D Wins (same race) — Career wins at today's course, in today's race type, within 110 yards of today's distance — all satisfied in the same past race. This is the Bet Finder's "C&D Winner": tighter than holding a course win and a distance win earned in different races.
- Distance Runs (today's trip) / Distance Wins (today's trip) / Distance SR % (today's trip) — The horse's record within the Bet Finder's graded trip window of today's distance, in today's race type — its "Horse Form at Distance" numbers. The window widens with the trip: within half a furlong up to 8f, 1f for 9–12f, 1.5f for 13–16f, 2f for 17–20f, 2.5f for 21–24f, and everything from 3m up counts as one band. Pair the strike rate with a minimum on the runs to avoid tiny samples.
- Going Runs (actual going) / Going Wins (actual going) / Going SR % (actual going) — The horse's record on today's going, judging each past run on its actual (returned) going rather than the pre-race forecast, and using the Bet Finder's going buckets — Soft and Heavy pooled together, Good To Firm and Firm pooled, all-weather split by surface — within today's code (flat or jumps). This is the exact record behind the Bet Finder's "Horse Form on Going"; the Going Group fields further up use the standard official-going grouping instead.
- Horse Runs at Course Direction / Horse Wins at Course Direction / Horse SR % at Course Direction — The horse's record going today's way round (left- or right-handed), within today's code. The Bet Finder's "Likes Course Direction" = 2+ wins with SR 15%+; "Dislikes" = 4+ runs with SR 9% or less.
- Prominent Runs (last 5) / Prominent Runs (last 10) / Held-Up Runs (last 5) / Held-Up Runs (last 10) — How many of the horse's last 5 (or 10) pace-coded runs it raced prominently (P) or was held up (H). The count equal to the window (5 of 5, 10 of 10) reproduces the Bet Finder's "Prominent/Held Up Last 5/10 Runs" buttons; a softer "4+ of the last 5" is often more usable.
- Career Runs (this code) — Prior runs in today's code (flat vs jumps) — the sample the two Back2Lay percentages below are measured over.
- Traded 70%+ Below BSP In-Running (% of runs) / Traded 50%+ Below BSP In-Running (% of runs) — In what share of those runs the horse traded massively below its Betfair SP in-running: it repeatedly travels like the winner. The Bet Finder's trading angles: "Likely Back2Lay" = the 70% version in 55%+ of runs, "Possible Back2Lay" = the 50% version in 52%+ of runs — both with Career Runs (this code) between 3 and 10. In-running price coverage starts in 2018, so back-tests using these fields are floored to 2020.
- Runs Traded Below 2.0 In-Running — Prior runs where the horse hit odds-on in running (it looked the winner at some stage).
- Slow-Break Runs (career) — Flat/A-W runs whose in-running comment says the horse missed the break ("dwelt", "slowly away" and similar). The Bet Finder's "Slow Breakers" (a lay/trade angle) is 3 or more.
Earnings & research-only fields
- Horse Earnings Per Start (£) — Career prize money divided by number of starts — a rough quality gauge that blends how good the horse is with how valuable the races it contests are.
- Finishing Position — The horse's position in this race (1–60). This is a research filter only — it restricts your results to, say, winners (set to 1) or placed horses when you're studying what kind of runner won, not for predicting future races.
Tracks like today's
The horse's record before today on courses and trips like the one it runs on today, counting only runs in today's code (Flat or jumps). From Proform's course maps; a race the maps cannot place (some Curragh trips, Listowel's jumps races, a trip with no map within half a furlong) matches none of these.
- Horse Runs on Similar Tracks / Horse Win % on Similar Tracks / Horse PRB % on Similar Tracks / Best Speed Figure on Similar Tracks — its record on tracks with the same track type, gradient and direction as today's course and trip. 0 runs = it has run in this code but never on such a track; blank when it has no mapped run in today's code.
- Horse Runs / Win % / PRB % on Today's Track Type, on Today's Gradient and on Today's Direction — the same record on one fact at a time.
- Horse Runs / Win % / PRB % on Today's Number of Bends (Flat) and on Today's Rise or Fall (Flat) — Flat trips with the same number of bends, or rising or falling like today's (the Rise or Fall bands).
- Horse Runs / Win % / PRB % on Today's Climb in the Straight (jumps) — jumps courses whose home straight climbs or falls like today's.
The Market filters are all about the betting price of a horse and how that price moved. In racing, the price (or "odds") is the market's opinion of a horse's chance — short odds (like 2/1) mean the market thinks it's likely to win, long odds (like 25/1) mean it's an outsider. These filters let you build systems around how fancied a horse was and whether the money came for it or deserted it.
A few terms used throughout, defined once here:
- SP (Starting Price) — the official odds at the moment the race starts, set by the bookmakers. The "final" market verdict on each horse.
- ISP (Industry SP) — the standard bookmaker Starting Price (what you'd see quoted in the results).
- BSP (Betfair Starting Price) — the equivalent figure on the Betfair betting exchange, where punters bet against each other. It often differs slightly from the bookmaker SP.
- Odds-against "to 1" — these price fields are expressed as the number after the slash:
1= evens (1/1),0.5= 1/2 (odds-on),4= 4/1. So a smaller number means a shorter price (more fancied). - Favourite — the horse with the shortest price in the race (the market's top pick).
- Steamer / drifter — a "steamer" is a horse whose price shortens (gets backed), a "drifter" is one whose price lengthens (money walks away).
The price itself
- ISP (odds to 1) — the Industry Starting Price as odds-against.
1= evens,0.5= 1/2,4= 4/1. You'd use this to restrict a system to a price band, e.g. set ISP between 2 and 6 to study horses returned 2/1 to 6/1 and ignore both odds-on shots and rank outsiders. - Price Ratio SP (odds ÷ field) — decimal SP divided by the field size: 3/1 in a 9-runner race = 4.0 ÷ 9 =
0.44; 2/1 in a 3-runner race =1.0. A price measure you can compare across ANY field size — lower = shorter relative to the field. You'd use this to define "well fancied" consistently whether it's a 5-runner or a 20-runner race, where a raw price band can't. Post-race only (the SP is set at the off). - Price Ratio BSP (odds ÷ field) — the same measure built on the Betfair SP. Exchange books sum to roughly 100% whatever the field size, so this is the purest field-size-consistent version of the ratio. Post-race only.
- Power Odds (decimal) / Tissue Price (decimal) — the price Proform's Power Rating puts on the horse, and the price its tissue does, as decimal odds (4/1 = 5.0). Both are set before the race, so they work for today's qualifiers, and both drop runners the rating or tissue does not price. Example: Power Odds (decimal) ≤ 5 keeps the horses the Power Rating makes 4/1 or shorter.
- BSP / ISP / Evening / Breakfast / Morning vs Power Odds (value ratio) — Proform's Power Rating doesn't just rank the field, it prices it: the "Power Odds" are the odds the rating thinks each horse should be. These five filters divide the actual market price (as decimal odds) by that rated price. Above 1 means the market is offering MORE than the rating's assessment — value on the ratings' terms; a ratio of 1.5 means the market price was 50% bigger than the rated price. The BSP and ISP versions are post-race research tools; the Evening (~8:30pm before), Breakfast (~7:30am) and Morning (~10:30am) versions use bookmaker prices recorded from 2018 and are pre-race, so a rule like "Evening Price vs Power Odds is 1.2 or more" becomes a nightly value screen your qualifier emails can act on.
- Tissue Price (decimal) — Proform's tissue as a price: its own forecast of what each horse should be, written as decimal odds (4/1 =
5.0) so it sits on the same footing as the bookmaker prices below. It is the price version of the Tissue Rating in the Ratings group, and the two always put a field in the same order. It is set with the declarations, so it works for qualifiers; runners without a tissue drop out. You can also show it in the Runs list — tick Tissue Price under Market in the drill-down columns. - Evening / Breakfast / Morning Price vs Tissue (value ratio) — the bookmaker price divided by the tissue price, both as decimal odds. Above 1 means the bookmakers are offering more than Proform's tissue; 1.5 means the price is 50% bigger than the tissue. All three are pre-race, so a rule like "Morning Price vs Tissue is 1.3 or more" is a race-morning value screen your qualifiers can act on.
- BSP (odds to 1) — the Betfair Starting Price as net odds-against (your stake is excluded, so it's directly comparable to the ISP figures). Use it instead of ISP if you bet on the exchange.
- BF Place Price (odds to 1) — the Betfair Starting Price in the place market (the odds for the horse to be placed rather than to win), as net odds-against — so
1= evens the place, and it sits on the same "to 1" scale as the win prices above. Post-race. You'd use this to research each-way or place-only angles, e.g. keep only horses whose place price was above a threshold.
Favouritism & market position
Rather than a raw price, these tell you where a horse sat in the betting compared to its rivals — which is often more meaningful than the price on its own.
- Favourite Status — pick from Favourite, Joint Favourite (tied for shortest), 2nd Favourite (second-shortest), or Joint 2nd Favourite. You'd use this to build a "back the favourite" system, or to deliberately study second-favourites.
- SP Rank — the horse's position in the betting order by Starting Price, where
1= the shortest price (the favourite), 2 = second-shortest, and so on. Similar to Favourite Status but as a number you can put a range on — e.g. SP Rank ≤ 3 keeps only the top three in the market. - BSP Rank — the same idea but ranked by Betfair SP within the race:
1= shortest BSP. Post-race data. - SP Rank Change vs LTO — how the horse's market position has shifted since "LTO" (Last Time Out — its previous race). A negative number means it's better fancied today than last time (it moved up the betting order). You'd use this to find horses the market suddenly rates more highly than it did before. Post-race data.
Bookmaker prices through the day
Bookmakers put up a price the night before and revise it as race day goes on. These three snapshots (all recorded from 2018, all in decimal odds — where 2.0 means evens, i.e. the price plus your stake back) let you see the price at fixed points and, by comparing them, spot which way the money is flowing.
- Evening Price (decimal) — the bookmaker price the evening before the race (set around 8:30pm). The "overnight" price.
- Breakfast Price (decimal) — the price at about 7:30am on race day.
- Morning Price (decimal) — the price at about 10:30am on race day.
- Evening Price Rank — where the horse stood in the overnight market: its rank on the evening price within the race, where
1= the shortest evening price (the overnight favourite). The rank is worked out live across the field, and runners without a recorded price are left out. Recorded from 2018 — and because the evening price exists before the off, this works for finding qualifiers as well as for back-testing. You'd use this to ask "was it near the head of the market the night before?" without pinning down an exact price — e.g. Evening Price Rank ≤ 3 keeps the top three in the overnight betting whatever the prices themselves were. - Breakfast Price Rank — the same idea at about 7:30am on race day:
1= the shortest breakfast price in the race, ranked live across the field, unpriced runners excluded. Recorded from 2018, and usable pre-race for qualifiers. You'd use this to read market position at the first race-day snapshot — a horse that is breakfast rank 1 having been only mid-market the evening before has been backed to the head of the market overnight. - Morning Price Rank — market rank on the ~10:30am price:
1= the shortest morning price in the race, ranked live, unpriced runners excluded; recorded from 2018. This is the latest market position you can know before the off — SP Rank, its post-race cousin, only exists once the race starts. You'd use this to turn an SP Rank research finding into a rule you can actually bet: a system built on "morning rank ≤ 3" can be checked against live qualifiers in the morning, where the SP version can't.
Price moves (the money trail)
This is the heart of the Market category: fields that measure how far and which way a price moved between two points in time. They come in a clear, repeating pattern, so learn the pattern once and the whole family makes sense.
Two flavours of "move":
- Points moves — the difference in odds-against expressed in points. For these, negative means the price got shorter (steamed in), positive means it drifted.
- Percentage shortening — how much shorter one price is than an earlier one, as a percentage. Here the sign is the opposite way round: a positive +% means the horse was backed in (shortened, a steamer), and a negative value means it drifted. For example +20 means "20% shorter" and -20 means 20% longer. That is why each one is named Shortening / Drift: one filter covers both directions. To find drifters, choose At most and type a negative number — At most -20 keeps runners whose price lengthened by 20% or more (4/1 the evening before out to 5/1 in the morning is -20). For steamers, choose At least and a positive number.
Points-based moves (negative = steamed in):
- SP Move vs Evening (pts) — SP minus the evening price, in points. Negative = steamed in from the night before.
- SP Move vs Breakfast (pts) — SP minus the breakfast price. Negative = a steamer through the morning.
Percentage shortening — pre-race moves (these compare two prices you already know before the off, so they can be used for finding qualifiers; all from 2018):
- Morning Shortening / Drift vs Evening (%) — morning price versus the overnight price. +20 = 20% shorter (backed in); negative = drifted.
- Breakfast Shortening / Drift vs Evening (%) — breakfast price versus overnight. +40 = breakfast is 40% shorter than the night before; negative = drifted overnight.
- Morning Shortening / Drift vs Breakfast (%) — morning versus breakfast. Positive = backed in through the morning, negative = eased. You'd use this to catch a horse the market is piling into late in the morning.
Percentage shortening — moves that end at the SP (these include the final Starting Price, so they're post-race; all from 2018). Positive = steamer, negative = drifter:
- SP Shortening / Drift vs Evening (%) — SP versus the overnight price. This is the overall move across the whole period.
- SP Shortening / Drift vs Breakfast (%) — SP versus the breakfast price.
- SP Shortening / Drift vs Morning (%) — SP versus the morning price — i.e. the late move into the off. You'd use this to isolate late steamers.
Percentage shortening — moves that end at the Betfair SP (post-race exchange data; all from 2018). Positive = shortened into the exchange:
- BSP Shortening / Drift vs Evening (%) — Betfair SP versus the overnight price. + = steamer into the exchange, − = drifter.
- BSP Shortening / Drift vs Breakfast (%) — Betfair SP versus the breakfast price: the move from the first race-day show into the exchange. + = backed in, − = drifter.
- BSP Shortening / Drift vs Morning (%) — Betfair SP versus the morning price — the late exchange move.
- BSP Shortening / Drift vs SP (%) — Betfair SP versus the Industry SP. Positive = BSP is shorter than the bookmaker SP (late/exchange money arrived); negative = BSP is bigger than SP (there was value at the off, the exchange paid more).
In-running (Betfair, during the race)
On the Betfair exchange, prices keep trading while the race is being run. A horse that looks like winning will trade at a very low price in-running; one that's struggling drifts out. These fields capture that — all are post-race only, since the trading happens during the race.
- In-Running Low (decimal odds) — the lowest price the horse was matched at in-running. A very low number means it travelled like a likely winner at some point (e.g. it was "hard to oppose in running"). You'd use this to find horses that looked all over winners yet got beaten — potential unlucky losers worth following next time.
- In-Running High (decimal odds) — the highest price it was matched at in-running. A very high number means it was given no chance at some stage.
- In-Running Low % Below BSP — how far that in-running low traded below the Betfair SP, as a percentage. Positive = it shortened in running (looked dangerous mid-race).
- In-Running High % Above BSP — how far the in-running high traded above the Betfair SP. Positive = it drifted in running (was in trouble mid-race).
All four also exist as LTO (and 2/3/4-runs-back) versions in the Last Time Out group — and because last time's trading is settled history, those versions do work for finding today's qualifiers.
This group lets you filter on a horse's ratings — the numbers that try to capture how good a horse is. A rating is just a score: the higher the number, the stronger the horse is judged to be. Some come from the official handicapper (the BHA's mark used to allot weight), and many more are Proform's own ratings — power ratings, speed figures, pace, and so on. You'd reach for these filters when you want to build a system around how a horse is rated rather than its breeding, its connections, or the betting market.
Almost everything here is known before the race runs, so these filters work for live qualifiers (finding today's runners that fit your system) as well as for back-testing past races.
The three-part pattern: Value, Rank, and "Clear by"
This is the single most important thing to understand in this section, and once you've got it the whole group falls into place. Almost every rating comes as a trio of three filters, all describing the same underlying number in three different ways:
- Value — the raw rating itself (e.g. "Official Rating between 70 and 85"). Use this when you care about the actual score.
- Rank — where that rating places the horse within today's race. 1 = top rated (the highest-rated runner in the field), 2 = second top rated, and so on. If two horses share the same rating they share the same rank (a joint top-rated pair are both rank 1). Use this when you care about how the horse compares to its actual rivals, not the absolute number — "top-rated on speed" is a rank filter (Rank = 1).
- Clear by — how many points clear the horse is of the next runner below it on that rating. So "clear by 5" means the horse's rating is 5 points above the second-best in the race. The classic use is to pair it with Rank = 1 to find a horse that is not just top-rated but clearly top-rated — e.g. top-rated on Power Rating AND clear by at least 8 points, which weeds out races where the top two are neck-and-neck. On its own it's measured from the next runner below, so it's most meaningful combined with the matching Rank.
Below, each rating is described once; assume it offers the full Value / Rank / Clear by trio unless noted. A few quick definitions you'll see repeatedly: OR = Official Rating (the handicapper's mark). A speed figure is a number summarising how fast a horse ran, adjusted for the conditions, so runs at different tracks can be compared. LTO means "last time out" (the horse's most recent run). A/E (actual vs expected) doesn't appear in this group but is explained elsewhere.
Headline ratings
- Power Rating — Proform's overall master rating for a horse, blending its form into a single figure of merit. A good first port of call for "how good is this horse, all things considered". Available as Value, Rank and Clear by. Example: Power Rating Rank = 1 and Power Rating: Clear by ≥ 10 isolates dominant favourites on the figures.
- Official Rating — the BHA handicapper's mark, the number used to decide the weight a horse carries in handicaps. Higher = a better horse on official assessment. This is the right field for handicap-mark analysis (e.g. Official Rating between 0 and 75 for lower-grade handicappers). Trio: Value, Rank, Clear by.
- OR vs Race Average — the horse's official rating minus the average official rating of the race (see Race Average Official Rating under the race filters), to one decimal place. Below 0 means it is rated lower than the average runner, so in a handicap it is among the lighter weighted; at most -5 picks the horses rated at least 5 below the average. Races with fewer than three rated runners are left out. It is known before the race, so it lists today's qualifiers too, and the OR vs Race Average breakdown shows each band from 10 or more below to 10 or more above.
- Tissue Rating — Proform's "tissue", an in-house assessment expressed as a rating (a tissue is a forecast of how a horse should be priced/rated for the race). Trio: Value, Rank, Clear by. The same tissue as a price is Tissue Price (decimal) in the Market group, with value ratios against the bookmaker prices.
- PFR — a Proform rating figure for the horse. Use it like any other rating — as a Value threshold, as a within-race Rank, or with Clear by. Trio: Value, Rank, Clear by.
- Main Rating / Main+Stats Rating — the ratings on the Main ratings tab of the Proform software; Main+Stats is the Main rating with the Stats rating added. Trio: Value, Rank, Clear by.
- Pace Rating — how often the horse has been up with the pace in its last three runs: 4 points each time it led, 2 each time it raced prominently, 0 when it was held up. So 12 means it led all three times, 8 might be led twice and held up once, and 0 means it was held up every time (or has no previous runs). Useful for pace-based angles, e.g. Pace Rating Rank = 1 to find the likely strongest pace figure in a race. Trio: Value, Rank, Clear by.
- Pace Rating: % of Race Total — this runner's Pace Rating as a percentage of the race's combined Pace Ratings — in other words, how much of the field's early speed it holds. It's the sharper "will it get an easy lead?" question: a Pace Rating of 8 means little if three rivals also have 8, but a lot if the rest of the field has none. A horse holding 30%+ of the race's pace with a Pace Rating of 8+ is the Bet Finder's "Highly Likely to Lead" profile (Pace Rating 8+ alone is its "Possible Leader"). Computed live within each race, so it works for today's qualifiers too.
- Stats Rating — a rating built from statistical strike-rate-style angles for the runner. Trio: Value, Rank, Clear by.
Connections-based stats ratings
These four ratings score the runner on the recent record of the people attached to it — the trainer, the jockey, and the two together — plus the horse itself. As with everything here, each has the Value / Rank / Clear by trio (Rank 1 = the best-rated runner in the field on that measure).
- Trainer Stats — a rating reflecting the trainer's statistical record relevant to this runner. Trio: Value, Rank, Clear by.
- Jockey Stats — the equivalent rating for the jockey's record. Trio: Value, Rank, Clear by.
- Trainer/Jockey Stats — a combined rating for the trainer-and-jockey partnership, capturing how well that specific pairing performs. Trio: Value, Rank, Clear by. Example: Trainer/Jockey Stats Rank = 1 to back the strongest partnership figure in the race.
- Horse Stats — a stats-based rating for the horse itself. Trio: Value, Rank, Clear by.
Speed figures — career and recent
This block covers Proform's speed figures, summarised in a few different ways. "HA" figures are best (highest) speed figures; "MR" figures are median speed figures (the middle value once the figures are ordered — a consistency measure that one freak run can’t distort). "Career" looks across the whole career; "1 Yr" restricts to the 12 months before the race; and one looks at just the last three runs. All five count only runs under today’s race type (turf, all-weather, chase, hurdle or bumper) — so for a turf race, all-weather figures are ignored. Each has the full Value / Rank / Clear by trio, so you can filter on the raw figure, on being top-rated on it within the race, or on being clear of the field.
- Speed: Career Best (HA) — the horse's highest-ever speed figure over its whole career under today's race type. The classic "how fast has this horse ever been" measure. Trio: Value, Rank, Clear by.
- Speed: Recent Best (HA 1 Yr) — the horse's best speed figure in the 12 months before the race, so it isn't flattered by a fast figure from long ago. Trio: Value, Rank, Clear by.
- Speed: Recent Best (HA 90 Days) — the horse's best speed figure in the 90 days before the race, the sharpest “current form on the clock” window. We back-tested it before adding it: the top-ranked horse on the 90-day figure wins more often than the top-ranked on the 1-year version, especially in handicaps. Pair: Value, Rank — plus a Yes/No Speed: 90-Day Best From A Win filter for whether that best recent figure was posted when winning or in defeat (the “top figure without the win” angle).
- Speed: Career Median (MR) — the horse's median speed figure across its career (a consistency measure rather than a one-off peak). Trio: Value, Rank, Clear by.
- Speed: Recent Median (MR 1 Yr) — the median speed figure over the 12 months before the race, reflecting the horse's current typical level. Trio: Value, Rank, Clear by.
- Speed: Last 3 Runs Median (MR) — the median speed figure of the horse's last three runs, the tightest "current form" version. Use it for "in-form on the clock right now" angles. Trio: Value, Rank, Clear by.
Speed figures from individual recent runs
These pick out the speed figure recorded in one specific recent run, counting back from the latest. "LTO" is the last run; "2 Back", "3 Back" and "4 Back" step further into the past. Use them to demand recent figures of a certain level, or to compare a horse's last few runs. Each has the Value / Rank / Clear by trio.
- Speed Figure LTO — the speed figure from the horse's last run. Example: Speed Figure LTO Rank = 1 finds the horse that posted the fastest figure last time out among today's field. Trio: Value, Rank, Clear by.
- Speed Figure 2 Back — the speed figure from two runs ago. Trio: Value, Rank, Clear by.
- Speed Figure 3 Back — the speed figure from three runs ago. Trio: Value, Rank, Clear by.
- Speed Figure 4 Back — the speed figure from four runs ago. Trio: Value, Rank, Clear by.
Combined Power/Speed ranks (Bet Finder-style)
Two special rank filters combine the Power Rating rank and the Speed Figure LTO rank into one number — the pair the Proform Bet Finder uses for its "Ratings" and "Speed" buttons. They exist because "top 3 on ratings or speed" can't be written as two ordinary rules (all rules must be true at once), so the combining is done inside the filter instead. Only ratings the horse actually holds are counted — a horse with a Power Rating but no last-time-out speed figure is judged on its power leg alone (a runner needs at least one of the two). Both are ranked live within each race and work for today's qualifiers.
- Power/Speed LTO: Best Rank — the better (lower) of the ranks the horse holds. ≤ 3 means top-3 on ratings or speed (the Bet Finder's "Top 3 Ratings OR Speed").
- Power/Speed LTO: Worst Rank — the worse (higher) of the ranks the horse holds. Above 5 means outside the top 5 on ratings or speed (the Bet Finder's "NOT Top 5 Ratings OR Spd" lay angle).
- Power Rating Rank (all runners) — the Power Rating rank with every runner ranked: horses without a rating sit at the bottom of the field instead of dropping out of the ranking. That is the treatment the lay-side buttons need — "not in the top 5" should catch the unrated runners too, not quietly ignore them. Set it to
6or more for the Bet Finder's "NOT in Top 5 on Ratings". - Speed LTO Rank (all runners) — the same every-runner treatment applied to the last-time-out speed figure: horses without a figure rank at the bottom of the field.
6or more = the Bet Finder's "NOT in Top 5 on Speed". - Power/Speed LTO: Worst Rank (all runners) — the all-runners version of the Worst Rank above: the worse of the two ranks, with every runner ranked on both scales and missing ratings sitting at the bottom.
6or more = the Bet Finder's "NOT Top 5 Ratings OR Spd".
For the AND versions ("Top 3 Ratings AND Speed", "NOT Top 5 Ratings AND Spd") you don't need these — pair the ordinary Power Rating Rank and Speed Figure LTO Rank rules and the everything-must-match behaviour does the AND for you.
PRC ratings (per-run class ratings)
The PRC block gives a rating for individual recent runs, plus an average. Like the speed-figure block, you can use the average for an overall picture or the per-run versions to inspect specific recent races. Each has the Value / Rank / Clear by trio.
- PRC Average — the horse's average PRC rating, a single summary figure. Trio: Value, Rank, Clear by.
- PRC Last Run — the PRC rating from the horse's most recent run. Trio: Value, Rank, Clear by.
- PRC 2nd Last Run — the PRC rating from two runs ago. Trio: Value, Rank, Clear by.
- PRC 3rd Last Run — the PRC rating from three runs ago. Trio: Value, Rank, Clear by.
How the trio is named in the rule picker. Each rating's three filters appear under the rating's own name: the value form is just the name (e.g. Speed: Career Best (HA)), the rank form adds "Rank" (Speed: Career Best (HA) Rank), and the clear-by form adds ": Clear by" (Speed: Career Best (HA): Clear by). The same pattern applies to every rating on this page — Official Rating: Clear by, Tissue Rating: Clear by, PFR: Clear by, Pace Rating: Clear by, Stats Rating: Clear by, Trainer Stats: Clear by, Jockey Stats: Clear by, Trainer/Jockey Stats: Clear by, Horse Stats: Clear by, PRC Average Rank, PRC Last Run: Clear by, PRC 2nd Last Run Rank, PRC 3rd Last Run: Clear by, Speed Figure LTO: Clear by, Speed Figure 2 Back Rank, Speed Figure 3 Back Rank, Speed Figure 4 Back Rank and so on, right through the speed families (Speed: Recent Best (HA 1 Yr) Rank, Speed: Career Median (MR) Rank, Speed: Recent Median (MR 1 Yr) Rank, Speed: Last 3 Runs Median (MR) Rank and their Clear-by forms — Speed: Recent Best (HA 1 Yr): Clear by, Speed: Career Median (MR): Clear by, Speed: Recent Median (MR 1 Yr): Clear by and Speed: Last 3 Runs Median (MR): Clear by). The run-by-run speed figures have their own Clear-by forms too (Speed Figure 2 Back: Clear by, Speed Figure 3 Back: Clear by, Speed Figure 4 Back: Clear by), as does the PRC block (PRC Average: Clear by, PRC 2nd Last Run: Clear by, plus PRC 3rd Last Run Rank to complete its trio — 1 = top rated, joint ratings share a rank). Every Clear-by reads the same way: points clear of the next-rated runner below on that scale, at its most powerful paired with the matching Rank = 1 rule to mean "top-rated and clear by at least N".
These filters use RaceMetrics' own ratings — the numbers we calculate in-house, shown on every racecard. They are different from the official handicap mark and from the Proform speed/power figures in the main Ratings group. RaceMetrics ratings are Elo-style: every horse, trainer, jockey, sire, dam, damsire and owner carries a rating that goes up when they do better than expected and down when they do worse, race after race. Most sit on a scale from about 1000 to 2000, where a higher number means a stronger record. ("Elo" is the same rating idea used in chess — you gain points beating strong opponents and lose points to weaker ones.)
The big thing to understand: these are point-in-time. When you back-test, the System Builder uses each runner's rating as it stood on the day of that race — not today's rating. So a horse that has since improved won't get credit for it in an old race. That keeps your results honest and avoids "knowing the future".
You'd reach for this group when your idea is about class and quality — "only the highest-rated horse in the race", "a horse running for one of the strongest trainers", "the best-bred runner on paper" — rather than about the form details, the market, or the going.
The Value / Rank / Clear-by pattern
Most ratings in this group come as a small family of related filters. Learn the pattern once and it applies everywhere:
- Value — the rating number itself (e.g. "Horse Rating is 1500 or more"). Use this to set an absolute quality bar.
- Rank — where that rating places the runner within today's race. 1 = best in the race, ranked across the declared field. Use this for ideas like "the top-rated horse" regardless of the actual number, because a 1500 might be top in a weak race but mid-pack in a strong one. Joint ratings share a rank.
- Clear by — how many points the runner is ahead of the next-best runner below it. This measures dominance. Pair it with Rank = 1 to mean "top-rated, and clear by at least N points" — i.e. a standout, not a runner just nudging ahead of the pack. Example: Rank = 1 plus Clear by ≥ 20 finds horses that are comfortably top-rated.
Horse rating
- Horse Rating (RM) — the horse's own RaceMetrics rating (about 1000–2000) as it stood for that race. This is the single best "how good is this horse" number we hold. Example: set it to 1500 or more to confine a system to genuinely well-regarded horses.
- Horse Rating (RM) Rank — its place in the field; 1 = the best-rated horse in the race. A classic starting point is Rank = 1 (back the top-rated runner) or Rank ≤ 3 (top three on ratings).
- Horse Rating (RM): Clear by — points clear of the next horse below. Combine with Rank = 1 to find clear standouts rather than narrow toppers.
Connections ratings (trainer, jockey, owner)
Each of the people around the horse also carries a RaceMetrics rating, again on the ~1000–2000 scale, point-in-time. Higher = a stronger recent record. Each comes as a Value plus a Rank (1 = best in the race).
- Trainer Rating (RM) / Trainer Rating (RM) Rank — the saddling trainer's strength. Use the Value for "a strong yard" (e.g. 1500+), or the Rank for "the most powerful trainer in the race".
- Jockey Rating (RM) / Jockey Rating (RM) Rank — the rider's strength. Handy for "a leading jockey booked" angles, or pairing a high jockey rating with a modestly-priced horse as a positive-booking signal.
- Jockey Rating Change vs LTO (RM) — the jockey upgrade: today's jockey's rating minus the rating of the jockey who rode the horse last time out, each as it stood on the morning of its own race. +100 or more is a significant upgrade; below zero is a downgrade. It is blank (so never matched) when the same jockey rides again or either rider has no rating. Its partner Jockey Change vs LTO (in the Last Time Out group) is a plain Yes/No: Yes = a different jockey, No = the same one again; debutants and reserve placeholders are left out of both. There is a matching breakdown (Down 100+ … Up 150+, plus Same jockey), and the Qualifiers tab and the Runs list can show LTO Jockey and Jky vs LTO columns. Better riders are usually reflected in the price — across 2025 the win rate climbs from 8.3% after a downgrade of 100+ points to 15.0% after an upgrade of 150+, while actual-vs-expected at Betfair SP stays close to 1.00 in every band — so treat it as a lens to combine with other rules, not an edge on its own.
- Owner Rating (RM) / Owner Rating (RM) Rank — the owner's record. Useful for spotting runners from powerful ownership operations.
Breeding ratings (sire, dam, damsire)
The horse's pedigree is rated too — the sire (father), dam (mother) and damsire (mother's father) each have their own RaceMetrics rating and rank. These are most useful for first-time-out or lightly-raced horses, where there's little form to go on and breeding does a lot of the talking (for example, a well-bred debutant on a surface or trip its sire's runners handle well). Same ~1000–2000 scale, point-in-time, Rank 1 = best in the field.
- Sire Rating (RM) / Sire Rating (RM) Rank — the father's rating and its rank in the race.
- Dam Rating (RM) / Dam Rating (RM) Rank — the mother's rating and rank.
- Damsire Rating (RM) / Damsire Rating (RM) Rank — the maternal grandsire's rating and rank.
Combined connection score
- Combined Score (RM) — the weighted RaceMetrics Combined connection score that's shown on racecards: it blends the connections' ratings into one number on the ~1000–2000 scale. Use it when you want a single "how strong is everything around this horse" figure rather than filtering on trainer, jockey and breeding separately.
- Combined Score (RM) Rank — its rank in the field; 1 = the best connections package in the race.
- Combined Score (RM): Clear by — points clear of the next runner below. Pair with Rank = 1 for "the standout connections package, clear by at least N".
Form-quality scores
These two aren't about a participant's standing — they grade how good a runner's recent form actually was, in ways a bare result can't show.
- Future Form Score / Future Form Score Rank — on a 0–100 scale, how well the runner's recent races have "worked out" — i.e. how the horses it ran against have gone on to perform since. A high score means it was beaten by (or beat) horses that turned out to be useful, so the form is reliable. The Rank (1 = best in the race, ranked across the declared field) lets you pick the runner whose form has been most strongly franked.
- Collateral Score / Collateral Score Rank — collateral form measured through shared rivals: it links horses that have met common opponents to judge who is really stronger. The scale runs roughly −5000 to +5000; positive = the form is franked (the runner looks well in on collateral lines), negative the opposite. The Rank (1 = best in the race, ranked across the declared field) finds the runner with the strongest collateral case.
- No Future Form Score / No Collateral Score — Yes/No filters for the runners these scores can't reach. Not every runner can be scored: about 8% have no scoreable recent races (so no Future Form score) and about 19% have no shared-rival form lines (so no Collateral score) — typically lightly-raced types. Yes = only unscored runners, for angles built on exactly the runners the ratings can't see; No = only runners that do carry a score.
AI rating
- AI Rating — the rating taken from our AI racecards, on a 0–200 scale. Important caveat: it has limited historical coverage (only about 8% of past runs), so a back-test over the AI Rating will be based on a small slice of history. It's best used for qualifiers (finding today's and tomorrow's runners) rather than for long historical back-tests, where the thin coverage can mislead.
- AI Rating Rank — its rank within the field; 1 = the AI's top-rated runner. Same coverage caveat applies.
The Connections filters are about the people behind each runner — the trainer (the yard that prepares the horse), the jockey (the rider), and the owner — plus a few breeding stats that sit alongside them. Every horse in a race has these connections, and they matter: a trainer in red-hot form, a jockey who is riding winner after winner, or an owner with a strong record can all tilt the odds.
You reach for these filters when your idea is about who rather than the horse itself — for example "only back runners from a trainer whose yard is firing right now", or "follow this one specific jockey". Many of these come as a repeating set of related numbers (a runs count, a strike rate, an A/E, and sometimes an ROI), measured over a recent time window. We explain that pattern once below, then list the family members.
Two pieces of jargon you will meet repeatedly. Strike rate (SR%) = the percentage of runners that won (5 winners from 50 runs = 10%). A/E = "Actual over Expected" — how many winners they actually had versus how many the betting market expected them to have; 1.0 is market-par, and a number above 1.0 means they beat the market (winning more often than their odds implied). SP means Starting Price, the official odds at the off.
Who's involved — search filters
These three let you name specific people. Start typing and pick from the search list; you can choose several at once.
- Trainer(s) — pick one trainer or a list of trainers to follow. Use this to build a system around a yard you rate (e.g. "only this trainer's runners"). Switch the rule to "Is none of" to do the opposite — exclude a trainer or list from an otherwise-broad system.
- Jockey(s) — pick one rider or a list. Use it to follow a particular jockey, or a stable of riders you trust. "Is none of" excludes the chosen rider(s) instead.
- Owner(s) — type to search and multi-select one owner or a list. "Is none of" excludes a list, and "Contains" matches part of a name — handy for big operations whose horses run under slightly different ownership labels (e.g. anything containing "Godolphin").
- Trainer Nation — where the yard is based:
Ireland(the whole island, Northern Ireland included),Great BritainorOverseas raider. Nobody publishes a yard's address in the data, so it is worked out each year from where the yard's runners race: at least half its runs on Irish courses makes it Irish; a yard that only ever appears in Britain with no recorded yard-to-course distance is a foreign raider (the French and American visitors at Royal Ascot, for instance); everything else is British. A yard with fewer than ten runs in a year is judged on its record to date. Pair it with Course Nation to ask the raiders question — "Irish-trained runners at British tracks" — or use "is none of Ireland" to keep a Cheltenham system to the home team. Known before the race, so it works for today's qualifiers.
Trainer recent form (the time-window family)
These describe how well the trainer's yard has been doing lately, across all their horses. They come in matching sets for two rolling windows — the last 14 days and the last 28 days — plus a "last 50 runners" set. The pattern for each window is the same: a Runs count (how many runners the yard had), a SR% (what share won), an A/E (did they beat the market), and for 28 days an ROI too.
- Trainer Runs (14d) — number of runners the yard has had in the last 14 days. A higher number means an active, in-form stable (and a bigger sample behind the SR/A/E).
- Trainer SR % (14d) — win strike rate over the last 14 days. Use it to catch a hot streak, e.g. "only trainers striking at 20%+ this fortnight".
- Trainer A/E (14d) — Actual/Expected wins over 14 days; above 1.0 means the yard is beating the market right now.
- Trainer Runs (28d) — runners in the last 28 days (a steadier, larger window than 14d).
- Trainer SR % (28d) — win strike rate over the last 28 days.
- Trainer A/E (28d) — Actual/Expected wins over 28 days.
- Trainer ROI % (28d) — return on investment over 28 days, betting 1 point on every runner at SP. Positive means a level-stakes profit; this is the bottom-line money figure rather than just how often they win.
- Trainer SR % (last 50 runs) — win strike rate over the yard's most recent 50 runners. A run-count window rather than a calendar one, so it always rests on the same sample size.
- Trainer A/E (last 50 runs) — Actual/Expected wins over the last 50 runners.
Trainer streaks and stable size
- Trainer Runs Since Win — how many runners the yard has had since it last won. 0 = it won with its most recent runner; a high number flags a stable out of form (or, to contrarians, one "due").
- Trainer Days Since Win — calendar days since the yard's last winner. Same idea measured in time rather than runners.
- Trainer Runners Today — how many horses this trainer has declared at today's meeting(s). Use it for angles like "trainer has only one runner today" (sometimes a sign of a targeted go) or to spot a busy multi-runner day.
Jockey recent form (same family, for the rider)
Identical idea to the trainer windows, but counting the jockey's rides. Again: gate strike-rate and A/E with the matching rides count.
- Jockey Rides (14d) — number of rides the jockey has had in the last 14 days (activity / sample size).
- Jockey SR % (14d) — win strike rate over the last 14 days. Catch a rider on a hot run.
- Jockey A/E (14d) — Actual/Expected wins over 14 days; above 1.0 = beating the market.
- Jockey Rides (28d) — rides in the last 28 days.
- Jockey SR % (28d) — win strike rate over 28 days.
- Jockey A/E (28d) — Actual/Expected wins over 28 days.
- Jockey ROI % (28d) — level-stakes (1pt, SP) return over 28 days; positive = a profit following all their rides.
- Jockey SR % (last 50 rides) — win strike rate over the rider's most recent 50 rides.
- Jockey A/E (last 50 rides) — Actual/Expected wins over the last 50 rides.
- Jockey Rides Since Win — rides since the jockey last won. 0 = won on the latest ride.
- Jockey Rides Today — how many rides the jockey is booked for today.
Trainer + jockey working together
This trio looks specifically at the combination of today's trainer and today's jockey — their joint record when they pair up. A strong combo can be more telling than either alone (some yards have a "go-to" rider for their best chances).
- Trainer/Jockey Combo Runs — career runs for this exact trainer-jockey pairing before today. Use it as the sample-size gate for the two below.
- Trainer/Jockey Combo SR % — win strike rate when this trainer books this jockey.
- Trainer/Jockey Combo A/E — Actual/Expected wins for the pairing; above 1.0 = the combo beats the market. Example: "combo A/E above 1.2 with at least 20 combo runs" finds a profitable partnership with enough evidence behind it.
- Trainer/Jockey Combo Runs (5yr) / Trainer/Jockey Combo SR % (5yr) / Trainer/Jockey Combo A/E (5yr) / Trainer/Jockey Combo Expected Wins (5yr) — the Bet Finder's version of the pairing record: the last 5 years only, within today's code (flat or jumps), with the A/E measured against the Betfair-style expected price and an Expected Wins figure as the sample-size guard (market-expected wins — how many winners the pairing "should" have had at its prices). The Bet Finder's "Good Together" button shows at A/E 1.1+ with 5+ expected wins, so those two rules recreate it exactly. Use the career trio above for the broadest view of a partnership; use these four when you want the exact Bet Finder definition.
At-course records (Bet Finder "Good/Bad at Course")
These measure how a trainer, jockey, trainer/jockey partnership or sire performs at today's course in today's race type — the numbers behind the Bet Finder's "Good at Course" and "Bad at Course" buttons, with the exact same definitions. Trainer, jockey and partnership records cover the last 5 years; the sire's covers 2014 onwards. Each comes as a quartet: Runs, SR %, A/E and Expected Wins. The A/E here is measured against the Betfair-style expected price (no bookmaker margin), so 1.0 really is market-par. The Bet Finder's gates translate directly: "Good at Course" = Expected Wins 5+ with A/E 1.1+; "Bad at Course" = Expected Wins 5+ with A/E 0.7 or less — always pair the A/E with the Expected Wins guard so a tiny sample can't flatter.
- Trainer Runs at Course (5yr) / Trainer SR % at Course (5yr) / Trainer A/E at Course (5yr) / Trainer Expected Wins at Course (5yr) — the trainer's record at today's track and race type over the last 5 years: the exact numbers behind the Bet Finder's trainer "Good/Bad at Course" buttons.
- Jockey Rides at Course (5yr) / Jockey SR % at Course (5yr) / Jockey A/E at Course (5yr) / Jockey Expected Wins at Course (5yr) — the jockey's equivalent: rides, strike rate and market-beating record at today's course and race type over the last 5 years.
- Trainer/Jockey Runs at Course (5yr) / Trainer/Jockey SR % at Course (5yr) / Trainer/Jockey A/E at Course (5yr) / Trainer/Jockey Expected Wins at Course (5yr) — the partnership's record when this trainer and this jockey team up at today's track, same 5-year window and race-type scope.
- Sire Runs at Course / Sire SR % at Course / Sire A/E at Course / Sire Expected Wins at Course — progeny record at today's track and race type (2014 on): the Bet Finder's "Likes/Dislikes Course" sire buttons.
Situational records (Bet Finder "Good With..." family)
These measure how a trainer (or, for the last one, a sire) performs with runners in a specific situation — returning from a break, wearing headgear for the first time, making a handicap debut, and so on. They power the Bet Finder's "Good With First Time Headgear"-style buttons with the exact same definitions: rolling 5-year records, split flat vs jumps, with the A/E measured against the Betfair-style expected price. Each comes as the usual quartet — Runs, SR %, A/E and Expected Wins — and the Bet Finder gates carry over: good = Expected Wins 5+ with A/E 1.1+; bad = Expected Wins 5+ with A/E 0.7 or less.
One special property: these numbers are only filled in when today's runner is actually in the situation. So a rule like "Trainer w/ LTO Winners: A/E ≥ 1.1" does two jobs at once — it keeps only horses that won last time out, and only those whose trainer has a strong record following up with them. You never need a separate rule for the situation itself.
- Trainer w/ Break Returners: Runs (5yr) / Trainer w/ Break Returners: SR % (5yr) / Trainer w/ Break Returners: A/E (5yr) / Trainer w/ Break Returners: Expected Wins (5yr) — the trainer's record with horses matching today's return profile: either off 90+ days or back out within a week. Only populated when today's runner fits one of those bands.
- Trainer w/ 1st-Time Headgear: Runs (5yr) / Trainer w/ 1st-Time Headgear: SR % (5yr) / Trainer w/ 1st-Time Headgear: A/E (5yr) / Trainer w/ 1st-Time Headgear: Expected Wins (5yr) — record with runners wearing headgear (blinkers, visor, hood...) for the first time. Only populated when today's runner wears a first-time aid.
- Trainer w/ LTO Winners: Runs (5yr) / Trainer w/ LTO Winners: SR % (5yr) / Trainer w/ LTO Winners: A/E (5yr) / Trainer w/ LTO Winners: Expected Wins (5yr) — record with horses that won their most recent start (can the yard follow up?). Only populated when today's runner won last time out.
- Trainer w/ Stable-Switch 1st Runs: Runs (5yr) / Trainer w/ Stable-Switch 1st Runs: SR % (5yr) / Trainer w/ Stable-Switch 1st Runs: A/E (5yr) / Trainer w/ Stable-Switch 1st Runs: Expected Wins (5yr) — record with horses on their first run after joining from another yard.
- Trainer w/ Stable-Switch 2nd Runs: Runs (5yr) / Trainer w/ Stable-Switch 2nd Runs: SR % (5yr) / Trainer w/ Stable-Switch 2nd Runs: A/E (5yr) / Trainer w/ Stable-Switch 2nd Runs: Expected Wins (5yr) — the same for the second run for the new yard.
- Trainer w/ 1st Handicap Runs: Runs (5yr) / Trainer w/ 1st Handicap Runs: SR % (5yr) / Trainer w/ 1st Handicap Runs: A/E (5yr) / Trainer w/ 1st Handicap Runs: Expected Wins (5yr) — record with horses making their handicap debut (often a well-planned target). Only populated when today is the horse's first-ever handicap.
- Trainer w/ 2yo Debutants: Runs (5yr) / Trainer w/ 2yo Debutants: SR % (5yr) / Trainer w/ 2yo Debutants: A/E (5yr) / Trainer w/ 2yo Debutants: Expected Wins (5yr) — record with two-year-olds on debut in today's race type (does the yard have them ready first time?).
- Trainer w/ 2yo 2nd Starts: Runs (5yr) / Trainer w/ 2yo 2nd Starts: SR % (5yr) / Trainer w/ 2yo 2nd Starts: A/E (5yr) / Trainer w/ 2yo 2nd Starts: Expected Wins (5yr) — record with two-year-olds on their second start (classic improvers' angle).
- Sire w/ 1st-Time Headgear: Runs (5yr) / Sire w/ 1st-Time Headgear: SR % (5yr) / Sire w/ 1st-Time Headgear: A/E (5yr) / Sire w/ 1st-Time Headgear: Expected Wins (5yr) — the sire's progeny record when headgear goes on for the first time. Only populated when today's runner wears a first-time aid.
Breeding stats living in this group
A handful of pedigree-performance numbers sit here too (separate from the pure pedigree names in the Breeding section). Sire/damsire/owner stats count only races before the day of the race, so they reflect what was known at the time.
- Sire Runs on Going Group — how many of the sire's offspring ("progeny") have run on today's going group (the going is bucketed into Firm+, Good, Good-Soft, Soft-Heavy, and All-Weather). The sample gate for the next two.
- Sire SR % on Going Group — win strike rate of the sire's offspring on today's going group. Use it to back the progeny of a sire whose stock clearly handle, say, soft ground.
- Sire A/E on Going Group — Actual/Expected wins for the sire's progeny on this going; above 1.0 = the market under-rates them in these conditions.
- Sire Runs at Distance Band — number of the sire's progeny runs at today's distance band (sample size).
- Sire SR % at Distance Band — win strike rate of the sire's offspring at today's trip — useful when you suspect a sire's stock want a specific distance.
- Sire Earnings Per Start (£) — career prize money per run across all the sire's progeny: a broad measure of the quality of stock a sire throws.
- Damsire A/E (career) — Actual/Expected wins, career-long, for the offspring of today's damsire (the broodmare's sire — the maternal grandsire). Above 1.0 = a maternal line the market tends to under-rate.
- Owner Runs (career) — career runs for today's owner (sample size for the two below).
- Owner SR % (career) — career win strike rate for the owner.
- Owner A/E (career) — Actual/Expected wins for the owner across their career; above 1.0 = an ownership whose horses beat the market.
- Sire Runs on Going (BF) / Sire SR % on Going (BF) / Sire A/E on Going (BF) / Sire Expected Wins on Going (BF) — the exact record behind the Bet Finder's "Sire Likes Going" button: progeny runs on today's going bucket — with each past run judged on its actual (returned) going rather than the forecast — in today's race type, since 2018. The A/E is on the Betfair-basis expected price and the Expected Wins field is its sample-size guard: "Sire Likes Going" shows at A/E 1.1+ with 5+ expected wins. Distinct from the sire going-group stats above, which use the standard going groups.
- Sire Runs at Distance (BF) / Sire SR % at Distance (BF) / Sire A/E at Distance (BF) / Sire Expected Wins at Distance (BF) — the exact record behind the Bet Finder's "Sire Likes Distance" button: progeny runs within the Bet Finder's graded trip window of today's distance (the same widening window described under the horse's "Distance Runs (today's trip)" — from half a furlong for sprint trips out to 2.5f for staying trips), in today's race type, since 2018. "Sire Likes Distance" shows at A/E 1.1+ with 5+ expected wins — pair the A/E with the Expected Wins guard.
The yard on tracks like today's
- Trainer Runs / Win % / PRB % on Similar Tracks (5yr), on Today's Track Type (5yr) and on Today's Gradient (5yr) — the trainer's runners over the five years before today on tracks with the same track type, gradient and direction as today's course and trip, or matching on one fact, in today's code. From 2023 on, so the five years are always full. From Proform's course maps; a race the maps cannot place (some Curragh trips, Listowel's jumps races, a trip with no map within half a furlong) matches none of these.
The Breeding & Pedigree filters describe a horse's family tree and the circumstances of its birth — who its parents and grandparents are, where it was bred and born, and how mature it is likely to be for its age. Pedigree shapes what a horse is built to do: some sire lines pass on stamina, others speed, some a knack for soft ground.
You would reach for these when your idea is about breeding rather than recent form — for example "only the progeny of this sire", "only Irish-bred horses", or "only the most physically forward two-year-olds". A few quick definitions: the sire is the father, the dam is the mother, and the damsire (or broodmare sire) is the dam's father — the maternal grandsire. Progeny just means a horse's offspring. (Note: pedigree performance stats like a sire's strike rate live in the Connections section; this section is about the names, origins and birth timing themselves.)
Naming the family
These four let you pick out specific bloodlines or breeders. Start typing to search, and select one or several. "Is none of" excludes a list, and "Contains" matches part of a name.
- Sire(s) — the father. Type to search and multi-select a list of sires to follow, or exclude a list. Use this to build a system around the offspring of a sire you rate.
- Damsire(s) — the broodmare sire (maternal grandfather). Pick a list, or exclude one. Useful when a particular maternal line is known to add stamina or soft-ground aptitude.
- Dam(s) — the mother. Search and multi-select a list, exclude a list, or match part of the name. Handy for following the progeny of a notable broodmare.
- Breeder — matches when the breeder's name contains your text, e.g. "Godolphin" or "Juddmonte". Lets you target (or avoid) the output of a specific breeding operation.
Where it was bred and born
- Country of Birth — where the horse itself was foaled. Options: Ireland, Great Britain, USA, France, Germany, Australia, Japan, Canada, New Zealand, Brazil. Use it for angles like "Irish-bred only" or to test how foreign-bred imports perform.
- Sire Country — the country associated with the sire (the father's base). Same list of countries. Use it to lean towards a particular regional sire pool.
The sire's age and crop
A sire's age tells you which "crop" (year-group of offspring) is running. Very young sires have only their first foals on the track, which is an unproven but sometimes profitable angle for sharp punters.
- Sire Year Born — the calendar year the sire was foaled. A direct way to target older, established sires or brand-new ones.
- Sire Age at Race (yrs) — the sire's age in the year of this race. When a stallion’s first two-year-olds appear depends on when he retired, not on his age: retire him after his three-year-old season and they run when he is 7; a year later and it is 8, which is the most common; race on to five and it is 9. So most first crops sit in the 7-9 band. It is a rough guide only — for an exact first crop use First-Season Sire or Sire’s Crop Number above.
- First-Season Sire — a Yes/No flag that is true when the race falls in the very year a sire's first two-year-olds reached the track. This is the classic freshman-sire angle, where the market has not yet learned how good (or bad) the stock are. It is worked out from when his progeny actually started running rather than guessed from his age, so it is exact: a stallion who raced on to five and one who retired at three are each counted from their own first crop. Sires with no juvenile runners — jumps sires — never match.
- Sire's Crop Number — the same idea with more control: 1 is the sire's first crop on the track, 2 his second, and so on. Use between 1 and 2 for the first two crops, or 3 or more to exclude freshmen entirely. There is a matching Sire's Crop breakdown so you can see how each crop performs before committing to a rule.
Across every two-year-old run since 2018, the first crop is the only one showing a positive return (A/E 1.03, ROI +4%) with every later crop negative — but the sample is not large enough to call that a reliable edge, so treat it as a starting point for your own testing rather than a finished angle.
How mature for its age
Thoroughbreds share an official birthday (1 January in the northern hemisphere), so a foal born in January is, in real terms, months older — and usually physically stronger — than one born in May of the same year. That maturity edge matters most for juveniles (young horses) early in the season.
- Foaling Month — the actual birth month (January through December). Pick the months you want; earlier-born horses are physically more mature as youngsters.
- Early Foal (Jan/Feb) — a Yes/No flag for horses born in January or February, the most physically forward youngsters. The shortcut for the classic "early foal in a juvenile race" angle — combine it with young horse ages and early-season months for the full edge.
The sire's progeny on tracks like today's
- Sire Runs / Win % / PRB % on Similar Tracks (5yr), on Today's Track Type (5yr) and on Today's Gradient (5yr) — the sire's progeny over the five years before today on tracks with the same track type, gradient and direction as today's course and trip, or matching on one fact, in today's code. The answer for a debutant or a lightly raced horse with no record of its own. From 2023 on. From Proform's course maps; a race the maps cannot place (some Curragh trips, Listowel's jumps races, a trip with no map within half a furlong) matches none of these.
"Last time out" (LTO) just means the horse's most recent previous run. These filters don't describe today's race at all — they describe what the horse did the last time it raced: where it finished, how far it was beaten, what kind of race it was, what price it went off at, and so on. They're how you build the classic form angles bettors talk about — "won last time", "dropping in class", "beaten favourite last time", "first run back after a break".
Because everything here is a settled historical fact (it already happened), these filters work for qualifiers too — i.e. they can flag horses in upcoming races, not just in your back-test of past races.
There are also three smaller sets that look further into the past: 2 Runs Back (the run before last), 3 Runs Back (the one before that) and 4 Runs Back (one deeper again). They work exactly like the LTO fields — same idea, just one or two runs deeper into the form. You'd use them to demand a pattern rather than a single recent run, e.g. "placed both of its last two starts".
4 means 4/1). Handicap = a race where the official handicapper assigns each horse a weight to try to make it a dead-heat; the horse's OR (Official Rating) sets that weight. Class runs 1 (best) to 7 (weakest). Going = how soft or firm the ground is. Draw = the starting-stall number on the flat.How it finished last time
- LTO Finishing Position — where the horse finished last time. LTO Draw IV, LTO Pace IV, LTO Tactical Score, LTO Draw x Pace IV and LTO Draw Group — the same Draw & Pace figures described in the Horse section, but as they stood last time out. The angle they exist for is "ran better than the result looks": pair LTO Draw IV at 0.8 or below with LTO Finishing Position in the first three to find a horse that finished well despite being drawn badly, then back it today from a fair draw. Debutants have no last run, so they drop out whenever any LTO filter is used.
1= it won last time out. You can use "is" (exactly), "is up to" (e.g. ≤3 = placed in the first three), or a range. A horse that didn't complete (fell, pulled up, unseated, etc.) has no number, so it never matches 1–60 here — to catch those runs instead, use LTO Non-Completion just below. Example: set this to1to follow last-time-out winners. - LTO Non-Completion (fell / PU / UR etc.) — Yes = the horse failed to complete last time out: it fell, unseated its rider, was pulled up, brought down, refused or ran out. No = it completed the course (a disqualified horse counts as completed — it passed the post). Debutants are excluded either way. This is the one-rule way to build National Hunt angles like "returning after a fall" or "pulled up last time" — pair it with a Race Type of Chase or Hurdle today.
- LTO Distance Beaten (lengths) — how many lengths behind the winner it was last time.
0= it won. Finishers only. Example:0–2lengths finds horses that ran the winner close last time without necessarily winning. - LTO Favourite Status — its position in the betting market last time: Favourite, Joint Favourite, 2nd Favourite, Joint 2nd Favourite, or "Not 1st or 2nd Fav". Example: combine LTO Favourite Status = Favourite with LTO Finishing Position set to 2 or worse to find a beaten favourite last time — a horse the market liked but that didn't deliver.
- Beaten Favourite LTO — Yes = the horse went off outright favourite last time and did not win (a fall or other non-completion counts as beaten; joint favourites do not count). This is the exact Bet Finder "Beaten Favourite" definition, ready-made — the one-rule version of the Favourite Status + Finishing Position combination above.
- Placed LTO (place terms) — Yes = the horse won or finished in the official each-way places last time out (top 2, 3 or 4 depending on that race's field size); No = it ran and missed the places. Debutants are excluded either way — a horse with no last run never matches.
- 2nd-LTO / 3rd-LTO / 4th-LTO Placed (place terms) — the same test two, three and four runs back. "Not placed in its last two runs" is Placed LTO = No plus 2nd-LTO Placed = No. A finishing position of 2 or worse is not the same thing: that means "did not win", and it counts horses that finished second or third, which placed.
- LTO Run Style — how the horse ran the race last time: Led (made the running), Prominent (raced up with the pace), or Held up (settled at the back early). Useful for pace angles, e.g. front-runners that led last time.
- LTO In-Running Comment — searches the written race comment from last time for words like
led,held up,hampered,every chance. "Contains" matches the phrase; "does not contain" excludes it. Several phrases separated by|match any of them, soran on | kept on | stayed on | finished welltests a whole family of finishing comments as one system instead of four. Great for catching unlucky-in-running horses the bare result hides. - LTO Race Name — searches the NAME of the race the horse contested last time, e.g.
November Handicap,Derby,Ayr Gold Cup. "Contains" matches, "does not contain" excludes. It's how you turn "follow the form of that race" into a system: every horse whose last run came in a particular contest, back-tested over every renewal. The name is settled at declaration, so it works for today's qualifiers too — and it pairs naturally with Follow-up mode.
The conditions of that last run
These describe the race the horse last ran in — handy when you want it to have already proven itself (or struggled) under particular conditions before today.
- LTO Class (1-7) — the class of last time's race (1 = best, 7 = weakest). Choose a range, a list, or an exact class.
- LTO Distance (furlongs) — the trip last time, in furlongs (4–40). A furlong is one-eighth of a mile.
- LTO Distance (yards) — the exact trip last time in yards (1f = 220y), for yard-level control. Also available for the two runs before (2nd-LTO / 3rd-LTO Distance (yards)).
- LTO Distance to Nearest Furlong — last time's trip rounded to the nearest furlong (within 110y either side counts as that furlong). Also available as 2nd-LTO / 3rd-LTO versions.
- LTO Official Going — the official ground description last time (Hard, Firm, Fast, Good To Firm, Good, Good To Soft, Soft, Heavy, Standard, Slow).
- LTO Actual Going — the returned going for last time's race (the going as actually reported), same list of options. Use this when you trust the post-race ground description over the pre-race forecast.
- LTO Course — the racecourse the horse last ran at (pick one or more courses).
- LTO Course Direction — whether last time's track was Left-handed or Right-handed.
- LTO Course Characteristics — the shape of last time's track: Galloping (long, sweeping), Sharp (tight, quick turns), Stiff (testing, often uphill finish), Undulating (up-and-down), or Easy. Matches if any selected shape applies.
- LTO Course Country — where it last ran: Great Britain, Ireland, Northern Ireland, or UAE. Example: spot horses arriving from Ireland or returning from a Dubai campaign.
- LTO Field Size — how many runners were in last time's race (1–60).
- LTO Race Type — the code last time: Turf, A/W (all-weather), Chase, Hurdle, or NHF (National Hunt Flat / "bumper").
- LTO Race Handicap — a simple Yes/No: was the horse's last race a handicap? Set Yes to find horses stepping out of handicap company, or No to find ones coming from maidens, novices and other non-handicaps (a classic angle for handicap debuts). Also available as 2nd-LTO Race Handicap and 3rd-LTO Race Handicap for the two runs before. Debutants drop out either way.
- LTO Classification (any of) — the race "label" last time: Handicap, Maiden, Novice, Selling, Claiming, Classified, Nursery, Conditions, Auction, Apprentice Riders, Amateur Riders, Conditional Jockeys, Rated Stakes, Fillies, Mares, Juvenile, Median Auction, Showcase, EBF, Group 1–3, Grade 1–3, Listed, or Hunters Chase. Matches if last time's race carried any one you pick (a race can hold several), and picking more than one means or. Handicap is in this list too, so “was a handicap or a novice last time” is a single rule — the Yes/No filter above is simpler when it must be a handicap, and is the only way to say it was not. Example: select Maiden + Novice to find horses stepping up out of beginner races.
- LTO Draw — the stalls number it had last time (flat racing). Jumps runners have no draw.
- LTO Days Off (before that run) — how many days the horse had been off before its last run (0–3000). Note this is the gap leading into last time, not the gap into today (for today's gap, use "Days Since Last Run" in the Horse group).
Weight, jockey and headgear last time
- LTO Weight (lbs) — the weight it carried last time, in pounds (80–200).
- LTO Weight Rank — its weight position in last time's field.
1= top weight (carried the most). Lower numbers = more weight. - LTO Jockey — who rode the horse last time out. "Is any of" finds horses that were ridden by a chosen jockey (or list) at their last start; "Is none of" excludes them — note that "Is none of" also keeps debutants, since a horse with no previous run wasn't ridden by anyone last time.
- LTO Trainer — who trained the horse at its last run. Pair "LTO Trainer is X" with "Trainer is none of X" (in Connections) to catch horses that have just switched stables. "Is none of" keeps debutants, as above.
- LTO Jockey Claim (lbs) — the weight allowance the jockey claimed last time.
0= a fully qualified jockey; 3/5/7 = an apprentice or conditional (less experienced) rider claiming pounds off. - LTO Headgear — any aid worn last time: Blinkers, Cheekpieces, Visor, Hood, Tongue Strap, Wind Surgery, or No Headgear. Matches if any selected aid was worn.
Market and ratings last time
- LTO ISP (odds to 1) — the Starting Price last time, as odds-against (e.g.
4= 4/1,1= evens). Example:0.01–3finds horses sent off relatively short last time. - LTO Price Ratio SP (odds ÷ field) / LTO Price Ratio BSP (odds ÷ field) — the Price Ratio for the horse's LAST run: decimal odds that day (bookmaker SP, or BSP — the Betfair Starting Price) divided by that race's field size. How fancied it was relative to the field, comparable across field sizes — and because it's a settled historical fact, it works for qualifiers. Also available two and three runs back (see the 2 Runs Back and 3 Runs Back list below).
- LTO SP Rank — its position in the betting last time, by price.
1= it was the favourite. Example: a top-3 market rank last time that didn't win can flag a fancied horse worth another look. - LTO Tissue Rating — Proform's pre-race "tissue" (a forecast price/rating) from last time. (This is its own rating scale — don't compare it directly against other rating types.)
- LTO Official Rating — the official rating it ran off last time. Unrated runs drop out. Pair it with today's Official Rating, or use OR Change vs LTO for the difference.
- LTO Power Rating / LTO Power Rating Rank / LTO Power Odds (decimal) — the Power Rating it carried into its last race, where that put it in the field (
1= top rated that day) and the price the rating made it. Example: LTO Power Rating Rank = 1 with an LTO Finishing Position of 4 or worse finds horses the ratings liked last time that did not run to it. - LTO In-Running Low (decimal odds) / LTO In-Running High (decimal odds) — the lowest and highest prices the horse traded at on Betfair during its last race. A very low LTO In-Running Low means it travelled like the winner at some stage last time. Because last time's trading is settled history, these work for today's qualifiers — unlike the this-race versions in the Market group. In-running price coverage starts in 2018.
- LTO In-Running Low % Below BSP — how far that in-running low traded below its Betfair SP last time, as a percentage. Positive = it shortened in running;
60or more means it traded at least 60% below its BSP — it looked a big danger mid-race. The classic "travelled like a winner / unlucky last time" screen: pair it with LTO Finishing Position 2 or worse to find horses that traded short but got beaten. There's a matching breakdown (LTO In-Running Low vs BSP) so you can see how each band has actually performed before committing to a rule. - LTO In-Running High % Above BSP — the drift-side twin: how far the in-running HIGH traded above its Betfair SP last time. Positive = it drifted in running (was in trouble at some stage mid-race).
Change vs last time (today compared to LTO)
These don't describe last time on its own — they measure the difference between today and last time, so you can build "moving up/down" angles.
- Class Change vs LTO — today's class number minus last time's. A positive number means today's class number is higher, i.e. the horse has dropped in class into an easier race; a negative number means it's stepped up in class. Example:
+1or more finds class-droppers. - LTO Speed vs Class Par — how the horse's last-time-out speed figure compares with the class par — the typical winning figure for the class and race code it ran in (2yo races have their own, lower pars).
0means it ran right on a winning-standard figure for that grade; positive means it ran faster than a typical winner of that class, negative means slower. This is a one-number answer to "was that actually a good run for the level?" — a horse beaten a few lengths in Class 2 can still post a figure well above Class 4 par, while a scrambling win in a weak race can sit well below par. Runs with no speed figure (and race types/classes with no par) simply drop out rather than matching. Example: set this toat least 5to demand a last run that was above winning standard for its grade — strike rates climb steadily the further above par the figure is. - 2nd-LTO Speed vs Class Par — the same speed-versus-class-par comparison, one run deeper: the figure from the run before last against the par of the class it ran in that day. Use it with the LTO version to demand back-to-back above-par efforts — a pattern filter rather than a single-run one. Example: LTO Speed vs Class Par at least 0 plus 2nd-LTO Speed vs Class Par at least 0 keeps only horses whose last two runs were both up to winning standard for their grade.
- 3rd-LTO Speed vs Class Par — and one run deeper again: the speed figure three runs back against the par of that race's class. Combine all three legs to insist on a consistently strong figure profile, or contrast them — e.g. below-par three runs back but above par last time flags a horse trending sharply upwards on the clock.
- OR Change vs LTO — today's Official Rating minus last time's. Positive = the handicapper has raised the horse's mark since last time (it now has to carry more weight). Example: combine a positive OR move with a non-winning LTO finish to find "the handicapper put it up but it didn't actually win".
- Distance Change vs LTO (furlongs) — today's trip minus last time's. Positive = stepping up in distance; negative = dropping back. Example:
+2or more finds horses going up two furlongs or further. - Class Change vs last same-code run — like Class Change vs LTO, but measured against the horse's last run in the same code as today (flat runs compared with flat, jumps with jumps), so a switch between codes doesn't muddy the comparison. Today's class number minus that run's: positive = dropped into an easier grade, negative = up in class. Both classes must be known, so debutants and unclassified races never match.
- Distance Change vs last same-code run (furlongs) — today's trip minus the horse's last run in the same code (flat or jumps), in real furlongs. This is the measure behind the Bet Finder's "Up/Down in Distance" buttons — its 2f+ threshold is a true 440 yards. Positive = stepping up in trip against its last comparable run; negative = dropping back.
"Same as last time" toggles
- Same Course as LTO — Yes = the horse is back at the exact course it last ran at; No = it isn't.
- Same Going as LTO — Yes = today's going matches last time's; No = the ground has changed.
- Full of Running LTO — a sectional-data signal: on its most recent completed run (a fall / pulled-up / unseated run is skipped over), the horse was beaten but still recorded a top-2 run-out speed and finished faster than par in a field of 5 or more — i.e. it looked like it had plenty left and is one to forgive. This matches the "FoR LTO" badge on the racecard. Sectional coverage: ARC courses historically, RMG courses from May 2026; no Irish data.
2 Runs Back and 3 Runs Back
These two smaller sets mirror the LTO fields, but for the run before last (2 runs back) and the one before that (3 runs back). Use them when one recent run isn't enough proof and you want a consistent pattern — for example demanding the horse finished in the first three across each of its last two or three starts, or that it has run at a similar trip more than once.
Each of these two sets offers the same fourteen building blocks (with the same options and meanings as their LTO equivalents above):
- Finishing Position — 2nd-LTO Finishing Position / 3rd-LTO Finishing Position.
1= won that run; non-completions never match 1–60. - Run Style — 2-Back Run Style / 3-Back Run Style: Led, Prominent, or Held up.
- Class (1-7) — 2nd-LTO Class (1-7) / 3rd-LTO Class (1-7).
- Distance (furlongs) — 2nd-LTO Distance (furlongs) / 3rd-LTO Distance (furlongs).
- Official Going — 2nd-LTO Official Going / 3rd-LTO Official Going (same going list).
- Course — 2nd-LTO Course / 3rd-LTO Course.
- ISP (odds to 1) — 2nd-LTO ISP (odds to 1) / 3rd-LTO ISP (odds to 1), the Starting Price that run.
- Price Ratio SP / BSP (odds ÷ field) — 2nd-LTO Price Ratio SP (odds ÷ field) / 3rd-LTO Price Ratio SP (odds ÷ field), and on the exchange side 2nd-LTO Price Ratio BSP (odds ÷ field) / 3rd-LTO Price Ratio BSP (odds ÷ field): the decimal odds that day (bookmaker SP or Betfair SP) divided by that race's field size — how fancied it was relative to the field, on a scale you can compare across any field size.
- Field Size — 2nd-LTO Field Size / 3rd-LTO Field Size.
- Race Type — 2nd-LTO Race Type / 3rd-LTO Race Type: Turf, A/W, Chase, Hurdle, NHF.
- Favourite Status — 2nd-LTO Favourite Status / 3rd-LTO Favourite Status: Favourite, Joint Favourite, 2nd Favourite, Joint 2nd Favourite, or Not 1st or 2nd Fav.
- Days Off (before that run) — 2nd-LTO Days Off (before that run) / 3rd-LTO Days Off (before that run): the layoff the horse had going into that run. Useful for spotting form that came off a freshening break, or forgiving a flat run that came too quickly after the previous one.
- Headgear — 2nd-LTO Headgear / 3rd-LTO Headgear: what it wore that day. Compare across the last three runs to catch headgear going on or coming off mid-form-cycle.
- Distance Beaten (lengths) — 2nd-LTO Distance Beaten (lengths) / 3rd-LTO Distance Beaten (lengths): lengths behind the winner that day; winners and non-completions never match. Pair with the LTO version to demand two near-misses in a row — a horse knocking on the door.
- Draw — 2nd-LTO Draw / 3rd-LTO Draw: the stall it started from that day (flat races). Handy for forgiving a bad run from a hopeless draw two starts back.
- Weight (lbs) — 2nd-LTO Weight (lbs) / 3rd-LTO Weight (lbs): the weight the horse carried that day.
- Weight Rank — 2nd-LTO Weight Rank / 3rd-LTO Weight Rank:
1= it was top weight that day. - SP Rank — 2nd-LTO SP Rank / 3rd-LTO SP Rank:
1= it went off favourite that day. Lets you ask "was this horse fancied two or three starts back?" — a beaten favourite from two runs ago is often still well handicapped. - Tissue Rating — 2nd-LTO Tissue Rating / 3rd-LTO Tissue Rating: the forecast-price tissue rating it held going into that race.
- Jockey Claim (lbs) — 2nd-LTO Jockey Claim (lbs) / 3rd-LTO Jockey Claim (lbs): the apprentice/conditional weight allowance claimed that day (
0= a full professional rode). - Class Change — Class Change vs 2nd-LTO / Class Change vs 3rd-LTO: today's class number minus that run's.
+1or more = today is a drop in grade compared with that start; negative = a step up. Combine with Class Change vs LTO to demand a horse sliding steadily down the grades — or one being campaigned upwards. - OR Change — OR Change vs 2nd-LTO / OR Change vs 3rd-LTO: today's official rating minus the mark it carried that day. Shows what the handicapper has done to the horse across its last two or three runs — a horse
-5vs two starts back has been dropped 5lb since then. - Distance Change (furlongs) — Distance Change vs 2nd-LTO (furlongs) / Distance Change vs 3rd-LTO (furlongs): today's trip minus that day's. Positive = stepping up in distance compared with that run.
- Actual Going — 2nd-LTO Actual Going / 3rd-LTO Actual Going: the going that actually rode that day (the returned going, not the pre-race forecast).
- Course Direction — 2nd-LTO Course Direction / 3rd-LTO Course Direction: whether that run was on a left- or right-handed track.
- Course Characteristics — 2nd-LTO Course Characteristics / 3rd-LTO Course Characteristics: the shape of the course it ran at that day (stiff, sharp, undulating, galloping…).
- Course Country — 2nd-LTO Course Country / 3rd-LTO Course Country: where that run took place — e.g. find horses whose second-last start was in Ireland.
- Classification (any of) — 2nd-LTO Classification (any of) / 3rd-LTO Classification (any of): the race classifications that day (maiden, novice, seller, nursery…). "Won a maiden two starts back, now handicapping" is built from this.
- Same Course — Same Course as 2nd-LTO / Same Course as 3rd-LTO: yes/no — that run was at today's course. Deeper course-form than the LTO flag alone.
- Same Going — Same Going as 2nd-LTO / Same Going as 3rd-LTO: yes/no — that run was on today's official going.
- In-Running trading — 2nd-LTO / 3rd-LTO In-Running Low / High (decimal odds) plus the In-Running Low % Below BSP and In-Running High % Above BSP versions: the same Betfair in-running trading fields as LTO, one and two runs deeper (and available 4 runs back too). Demand a pattern — e.g. traded 60%+ below its BSP in each of its last two runs without winning.
This group is all about a horse's career record so far — how many times it has run, how often it has won or placed, what kind of races it has contested, and how its form has been trending. Reach for these filters when you want to demand some proven ability or experience ("only horses that have won at least twice"), or when you want to find a specific career profile ("lightly-raced maidens", "battle-hardened handicappers", "horses on a long losing run").
Every number here is calculated point-in-time. That means it only counts races that happened before the race you're looking at — never the race itself or anything after it. This is the honest way to back-test: when the System Builder checks a horse's record for a race run in 2021, it uses only what was known up to that day, exactly as you would have known it at the time. So "All Wins" for a debutant is 0, and a horse that has run ten times shows its first nine when assessed for its tenth start.
The big grid: a metric repeated for every race code
Most of this group is one simple idea repeated across the different kinds of racing. For each race code you get the same four counts:
- Runs — how many times the horse has run in that code.
- Wins — how many of those it won.
- Places — how many it placed in (here places means 2nd–4th only, excluding wins).
- Hcap Runs — how many of those runs were in handicaps.
- Maiden Runs — how many were in maiden races.
The race codes covered are: All (everything combined), Flat, Turf, A/W (all-weather), Jumps (everything over obstacles), Chase, Hurdle and NHF (National Hunt Flat / "bumpers"). Every filter accepts a single value, a minimum, a maximum, or a range. A common, sensible use is a minimum count to insist on experience — for example, All Wins ≥ 2 to demand a proven winner, or Flat Runs between 1 and 3 to find lightly-raced types still open to improvement. You'd reach for the code-specific versions when your angle only applies to one discipline — say Chase Wins ≥ 1 for a proven jumper over fences.
All codes — All Runs (career), All Wins (career), All Places (career), All Hcap Runs (career), All Maiden Runs (career).
Flat — Flat Runs (career), Flat Wins (career), Flat Places (career), Flat Hcap Runs (career), Flat Maiden Runs (career).
Turf (Flat run on grass) — Turf Runs (career), Turf Wins (career), Turf Places (career), Turf Hcap Runs (career), Turf Maiden Runs (career).
A/W (all-weather surfaces such as Polytrack or Tapeta) — A/W Runs (career), A/W Wins (career), A/W Places (career), A/W Hcap Runs (career), A/W Maiden Runs (career).
Jumps (all racing over obstacles combined) — Jumps Runs (career), Jumps Wins (career), Jumps Places (career), Jumps Hcap Runs (career), Jumps Maiden Runs (career).
Chase (over the bigger fences) — Chase Runs (career), Chase Wins (career), Chase Places (career), Chase Hcap Runs (career), Chase Maiden Runs (career).
Hurdle (over the smaller flights) — Hurdle Runs (career), Hurdle Wins (career), Hurdle Places (career), Hurdle Hcap Runs (career), Hurdle Maiden Runs (career).
NHF (National Hunt Flat / bumpers — for jumps-bred horses but with no obstacles) — NHF Runs (career), NHF Wins (career), NHF Places (career), NHF Hcap Runs (career), NHF Maiden Runs (career).
Career strike-rates
These turn the raw counts above into percentages. Crucially, a strike-rate on its own can be misleading: a horse that has run once and won shows 100%, but that tells you almost nothing. Always pair a strike-rate with the matching Runs filter so you only catch horses with a meaningful sample — for example Flat Win SR % ≥ 20 and Flat Runs (career) ≥ 5. Each is a percentage from 0–100 and accepts a minimum, maximum or range.
- All Win SR % — career win strike-rate across all codes combined.
- All Place SR % — career frame strike-rate (won OR placed) across all codes. Note this one includes wins, unlike the "Places" counts above.
- Flat Win SR % — career win strike-rate on the Flat.
- Flat Place SR % — career won-or-placed rate on the Flat (includes wins).
- Jumps Win SR % — career win strike-rate over Jumps.
- Jumps Place SR % — career won-or-placed rate over Jumps (includes wins).
Cheltenham Festival history
A set of filters for one special meeting — the Cheltenham Festival in March, jump racing's championship week. They let you build angles around horses with festival experience or a festival-winning pedigree of form. The first is a count; the rest are simple Yes/No flags.
- Cheltenham Festival Runs — how many times the horse has previously run at the Festival (a count, 0 if never).
- Ran at Cheltenham Festival — Yes/No: has it ever run there before?
- Won at Cheltenham Festival — Yes/No: has it ever won there?
- Placed at Cheltenham Festival — Yes/No: has it ever finished 2nd–4th there?
- Won or Placed at Cheltenham — Yes/No: has it ever won OR placed at the Festival? A handy single switch for "proven at the top level".
Form trends & droughts
These describe the shape of recent form rather than lifetime totals — useful for spotting horses coming into form, going off the boil, or due a change of luck.
- Runs Since Last Win — consecutive runs without a win (0 = won last time out). A horse that has never won shows its full career run count here. Use it to find in-form types (a low number) or to avoid horses on a long losing run.
- Days Since Last Win — calendar days since the horse last won. Horses that have never won are simply excluded (they have no value). You'd use this to find a horse that hasn't won for a long time but might be turned out under the right conditions.
- Best Finish (last 6) — the best finishing position among the completed runs in its last 6 starts (fallers, pulled-up and unseated runs are skipped over, not counted as a finish). 1 means it won one of them. Lower is better.
- Average Finish (last 6) — the average finishing position across those completed last-6 runs. A lower average points to consistent, near-the-front form.
- Overexposure % — the horse's career runs compared with the average career runs of its rivals in today's race (100 = exactly average; above 100 = more raced / more "exposed" than the field; below 100 = less exposed and potentially still progressive). Handy for finding the unexposed improver in a field of grizzled veterans.
- Horse Career Runs Rank — where the horse sits in today's field on number of previous runs. 1 is the most experienced runner, and 1 to 4 picks the four most-raced horses in each race. Horses with the same number of runs share a rank, and debutants are not ranked. Pair it with Horse Career Runs to set a minimum as well (10 or more runs, say). It is known before the race, so it also lists today's qualifiers, and the Career Runs Rank breakdown shows how each place in that order has performed. Back-tests start in 2023: our results go back to 2018, so for the first few years an older horse's count leaves out the runs it had before then. The Runs listing and both qualifier lists can show a Career Runs column.
- Wins in Last 3 Runs — how many of the last 3 starts were wins (0–3). "Won 2 of last 3" = set this to 2 or more. Needs at least 3 prior runs to apply.
- Top-3 Finishes in Last 3 Runs — how many of the last 3 starts finished in the top 3 (0–3). "Placed in all of the last 3" = set this to 3.
- Wins in Last 4 Runs — the same idea one run deeper (0–4). Needs at least 4 prior runs to apply.
- Top-3 Finishes in Last 4 Runs — how many of the last 4 starts finished in the top 3 (0–4). "Finished 1st–3rd in every one of its last 4 runs" = set this to 4 — a strict consistency filter. Horses that didn't complete (fell, pulled up) never count towards it, and a horse with fewer than 4 prior runs is left out rather than judged over a shorter run of form.
Jumping reliability
Three filters specifically for jumps horses, measuring how cleanly a horse gets round over obstacles — important because a faller or a horse that pulls up wins you nothing.
- Jumps Completions (career) — career jumps runs the horse actually completed (i.e. finished, rather than falling, being pulled up or unseating its rider).
- Jumps Non-Completions (career) — career jumps runs it did not complete (fell / pulled-up / unseated / refused / ran-out). 0 = a flawless record so far.
- Jumps Completion % — the share of its career jumps runs it completed. A low figure flags a faller or pulled-up risk you may want to avoid.
Situational change flags
Finally, a few Yes/No flags that capture a recent change in the horse's circumstances — the kind of "first time" or "now eased" angles that can spark improvement.
- First Run for New Trainer — Yes/No: the horse has never previously run for today's yard — its first start since genuinely moving trainer. The check recognises the same trainer recorded under separate British and Irish licences, so an Irish-trained horse popping over for one British run and coming home again does not count as two trainer changes. Debutants are excluded. A classic angle — a new trainer can revive a horse.
- Second Run for New Trainer — Yes/No: the horse's second run for its current trainer — last time out was its first-ever start for the yard. Catches the "now fully tuned by the new yard" follow-up.
- Third Run for New Trainer — Yes/No: the horse's third run for its current trainer — its first-ever start for the yard was two runs ago. With the first two it lets you compare the first, second and third runs after a move: back-test each in turn, or save all three and compare them in Portfolio.
- Second Run After Gelding — Yes/No: the horse's second start since being gelded (the operation happened two runs ago). This pairs with the First Time Gelded flag in the Horse group, which catches the very first run after gelding.
- Dropped in Grade vs 3 Runs Back — Yes/No: today's race is a lower grade (a higher class number) than the race three runs ago — i.e. the horse has been eased down in class across its recent campaign, often to find an easier opportunity.
This group is about how a horse runs a race, not just where it finished. Most form data only tells you the result. Sectionals break the race into segments and time each one — so we can see whether a horse came home fast at the end, jumped quickest out of the stalls, gained or lost places mid-race, and even how it physically moves (how long its stride is, how quickly its legs turn over). These clues often reveal a horse that ran better than its finishing position suggests, or one that wants a different trip.
Two things to know before you use these filters. First, they need the Sectionals add-on — they are only available to Proform Premium members who have sectional access. Second, sectional timing isn't recorded at every racecourse, and the camera-based (biometric) data is newer, so some of these fields only have data from 2023 onwards. Where that applies it's flagged below. If you build a system using these and get fewer matches than expected, the limited coverage is usually why — always pair a sectional figure with its matching "Runs" counter so you're not judging a horse on one or two races.
A few quick definitions you'll meet here. Sectional = the race timed in pieces. Finishing speed % = how fast a horse ran its closing stretch compared to its own average pace (100 = exactly average for that horse; over 100 = it quickened up). Par = the typical figure for that grade and ground, so you can tell good from merely fast. LTO = "last time out", the horse's most recent run. BSP = Betfair Starting Price (the odds at the off on the exchange).
How a horse moves — stride biometrics
These describe the horse's physical running action, averaged over its earlier runs that had sectional data. They hint at the kind of horse it is — a quick-turnover sprinter type versus a long-striding galloper. You'd use them to find horses whose natural action suits today's trip. Always gate them with the runs counter so you're not reading one race.
- Horse Avg Cadence (str/s) — average stride frequency (strides per second) over the horse's prior sectional runs. Higher = quicker leg turnover, a more sprinter-like action. You'd use this to hunt out fast-turnover types for a sharp 5–6 furlong sprint.
- Horse Avg Stride Length (ft) — average stride length in feet. Longer = more ground covered per stride, a galloping action that often suits longer trips and galloping tracks.
- Horse Runs with Sectionals — how many of the horse's past runs actually have stride data behind those two averages. This is a sample-size gate: set it to (say) 3 or more so cadence and stride-length aren't based on a single run. Use it alongside the two fields above, not on its own.
Away from the stalls — gate speed
Gate speed measures how quickly a horse gets into its stride from the start — useful for spotting natural fast starters, which matters most in big-field sprints and on draw-sensitive tracks. This is camera-based, so it only exists at biometric courses and the data starts in 2023.
- Horse Gate Speed (avg %ile) — the horse's average "quickest away from the stalls" ranking, shown as a percentile from 0 to 1, over its prior sectional runs. 1 = always the fastest into stride; 0.5 = middle of the pack. Use a high value to find horses likely to grab an early lead or a good early position. Biometric courses only, so data from 2023.
- Horse Gate-Speed Runs — how many past runs have gate-speed data. The sample-size gate for the field above — pair them so you don't judge gate speed off one start.
Right trip or wrong trip — Distance DNA
These compare a horse's sectional running pattern against the horses that win at the trips it has been running, to judge whether today's distance actually suits it. This is one of the more powerful sectional ideas: it can flag a horse crying out for further (or shorter) before the result makes it obvious.
- Horse Cadence vs Winners (str/s) — the horse's average stride frequency minus the typical winner's at the same trips. Negative = slower turnover than the winners (a sign it wants further); positive = quicker turnover (it may want shorter). You'd use a negative band to find horses stepping up in distance who should improve for it.
- Horse Distance DNA — the same idea boiled down to a plain verdict you pick from a list: Wants further, Wants shorter, or Right trip. The friendliest version of the cadence-vs-winners comparison. Needs at least 3 prior sectional runs before a verdict is given, so it won't fire on lightly-raced horses.
Finishing position after the upgrade
- Horse Positions Gained After Upgrade (avg) — over the horse's earlier sectional runs, the average number of places it would have gained (+) or lost (−) had it run each race efficiently: its finishing position minus its position once every runner's sectional upgrade is applied. A high figure marks a horse whose runs have kept being better than its finishing positions show. It is not ground made up during the race: for where a horse was lying, use the Early Position and Position 2f Out fields below.
This race vs last time out — the sectional pairs
The remaining sectional fields come as matched pairs: one measures the figure in the current/selected race (these are post-race facts, used when you're researching past results), and a second "LTO" version measures the same thing on the horse's last run. The LTO version is a settled historical fact, so it can be used to pick out today's qualifiers (e.g. "horses that finished fast last time"). For each pair, the meaning of the number is identical — only which race it's measured on changes. They are:
- Run-Out Speed (this race) / LTO Run-Out Speed — the horse's closing run-out speed taken from the sectionals (how fast it was travelling at the business end). A high LTO run-out speed is a classic "kept finding" signal worth following next time.
- Max Upgrade lbs (this race) / LTO Max Upgrade lbs — the biggest sectional "upgrade", expressed in pounds. This converts a strong sectional performance into a weight figure — how much better the horse looked on the clock than the bare result, in pounds. A big positive LTO upgrade flags a horse that arguably ran to a much higher level than it finished.
- Finishing Speed % (this race) / LTO Finishing Speed % — how fast the horse ran its closing section relative to its own average pace: 100 = its own average, above 100 = it quickened up at the end, below 100 = it was slowing. A high LTO finishing speed % is a sign the horse was running on through the line and may have more to give.
- Finishing Speed vs Par (this race) / LTO Finishing Speed vs Par — the finishing speed measured against a ground-adjusted par (the standard for that grade and going) rather than the horse's own average. Positive = it finished faster than par for the conditions, so this tells you whether a fast finish was genuinely good or just normal. Use a positive LTO band to find horses that beat the closing standard last time.
- Positions Gained After Upgrade (this race) / LTO Positions Gained After Upgrade — the places the horse would have gained in this one race (or last time out) had it run efficiently: its finishing position minus its position once every runner's sectional upgrade is applied. Finished 5th but 1st on the upgrade = +4; a minus figure means rivals had more to find. The single-race cousin of the average above. A strongly positive LTO figure points to a horse that ran better than its finishing position, one to follow. Not ground made up during the race.
- Max Upgrade Rank (this race) / LTO Max Upgrade Rank — where the horse ranked within the race on Max Upgrade over the last 4 furlongs (1 = the biggest sectional upgrade in the race). Interesting research note: rank 1 horses often UNDERPERFORM ranks 2-4 next time — the market tends to over-bet the flashiest sectional. The LTO version works in qualifiers.
- Finish Upgrade (this race) / LTO Finish Upgrade — the sectional upgrade earned in the Finish section itself (0 = none), as opposed to Max Upgrade, which takes the best over the last 4 furlongs. A positive LTO finish upgrade means the horse was still improving on the clock right at the line.
- Finish Upgrade Rank (this race) / LTO Finish Upgrade Rank — where the horse ranked within the race on that Finish-section upgrade (1 = the biggest finish upgrade in the race). The LTO version works in qualifiers — a top-2 LTO finish-upgrade rank is a tighter "kept coming at the line" sieve than the last-4f version.
- Run-Out Speed Rank (this race) / LTO Run-Out Speed Rank — where the horse ranked within the race on run-out speed, the speed it was still travelling at just AFTER the line (1 = strongest through the line). A top-2 run-out rank is the engine behind the Full of Running angle; this filter lets you set the threshold yourself.
- Lengths Gained After Upgrade (this race) / LTO Lengths Gained After Upgrade — the lengths-based twin: how many lengths closer to the winner the horse would have finished had it run efficiently (lengths beaten minus lengths beaten once every runner's sectional upgrade is applied). A horse can gain no places on the upgrade and still finish three lengths closer, so this catches what the places figure misses. Positive LTO values flag horses beaten further than their run deserved last time.
- Finishing Speed % Rank (this race) / LTO Finishing Speed % Rank — where the horse ranked within the race on finishing speed (1 = the fastest finisher). The rank strips out race-shape: a fast-run race lowers everyone’s finishing speed %, but the rank still tells you who finished best of those that ran. LTO rank 1-3 is a classic "ran on best, one to follow" sieve.
- Early Position (this race) / LTO Early Position — where the horse was lying at the end of the first sectional section, roughly 1-1.5 furlongs after the start (1 = led early). This is the front-runner finder: LTO Early Position = 1 picks out horses that blasted out and led early last time, and it works in qualifiers — a direct way to project today's likely pace.
- Early Lengths Behind Leader (this race) / LTO Early Lengths Behind Leader — lengths behind the leader at that same first section (0 = led). Because it's measured in lengths rather than places, it reads the same in a 5-runner race as a 16-runner one — "within a length of the lead early" often beats a raw position filter.
- Position ~2f In (this race) / LTO Position ~2f In — the horse's position at the end of the second section, roughly 2-2.5f after the start. Pair it with Early Position to separate genuine early leaders from horses that were rushed up after a slow start.
- Lengths Behind ~2f In (this race) / LTO Lengths Behind ~2f In — lengths behind the leader ~2-2.5f in (0 = led), the lengths-based twin of Position ~2f In.
- Position 2f Out (this race) / LTO Position 2f Out — where the horse was with 2 furlongs to run: the "turning in" snapshot. LTO Position 2f Out = 1 finds horses that hit the front early in the straight last time — combine with a finishing-speed field to split the ones that lasted home from the ones that folded.
- Lengths Behind 2f Out (this race) / LTO Lengths Behind 2f Out — lengths behind the leader with 2 furlongs to run (0 = led). A small LTO figure with a strong finishing-speed rank flags a horse that travelled into the race and kept going.
- Ran With Sectional Data LTO / Ran With Sectional Data (this race) — the tick-box from the desktop builder: set the LTO version to
Yesand your system only considers runners whose last run has TPD sectional coverage — essential scaffolding for any sectional system, so a horse without data can’t slip through a sectional rule by accident. The this-race version restricts a back-test to runs with coverage.
Sectional angles — Hard-Luck & Full of Running
Two one-tick Yes/No flags that package the same angles as the Hard-Luck Finder, so you can back-test and build systems on them. Each asks whether a run qualified as that angle; the LTO versions (the useful ones) ask whether the horse's last run did — i.e. "back the horse next time".
- Hard-Luck Story LTO — the horse was beaten last time, but the sectional model has it finishing first once its one inefficient section is corrected (checked, forced wide, or burned up in a duel). This is the standout sectional angle: backing these next start won about 19% of the time (against a ~11% baseline) for a small but genuine edge — roughly +3–4% ROI at Betfair SP net of commission over 7,000+ bets. Modest on its own, so pair it with a class-drop or a price band to sharpen it — e.g. adding "dropping in class" pushes the ROI past +8%. (There's also Hard-Luck Story (this race) for research on the current race — post-race, so back-test only.)
- Full of Running LTO — the horse was beaten last time but was still travelling fast after the line (top-2 run-out speed) and finished quicker than par. This is the emerald FoR LTO racecard badge. Honest note: these win more often than average next time, but at Betfair SP it's roughly break-even — the market already prices the eyecatcher in — so treat it as a shortlisting signal, not a blind bet. (A Full of Running (this race) research version exists too.)
RaceMetrics Tips
This last field isn't a sectional — it lets you bring our own published tips into your system as a building block. RaceMetrics Tips was retired in September 2026, but the whole published record from 2019 onwards is still here to test against: back-test the selections under conditions of your own choosing, or filter them out so you only see your angles.
- RaceMetrics Tip — a simple Yes/No flag. Yes = the runner was a published RaceMetrics daily tip; No = exclude the tips. Combine it with your own rules to test how the tips performed under certain conditions (e.g. "RaceMetrics Tips, in handicaps, at 5/1 or shorter"), or set it to No to make sure your system is finding something the tips didn't already flag. Tips data goes back to 2019.
Reading the results
Run a back-test and the Summary tab fills with the full record. Everything on it is a different way of asking one question: was that good? Here's every part in plain words — the same explanations appear on the screen itself when you hover anything with a dotted underline.
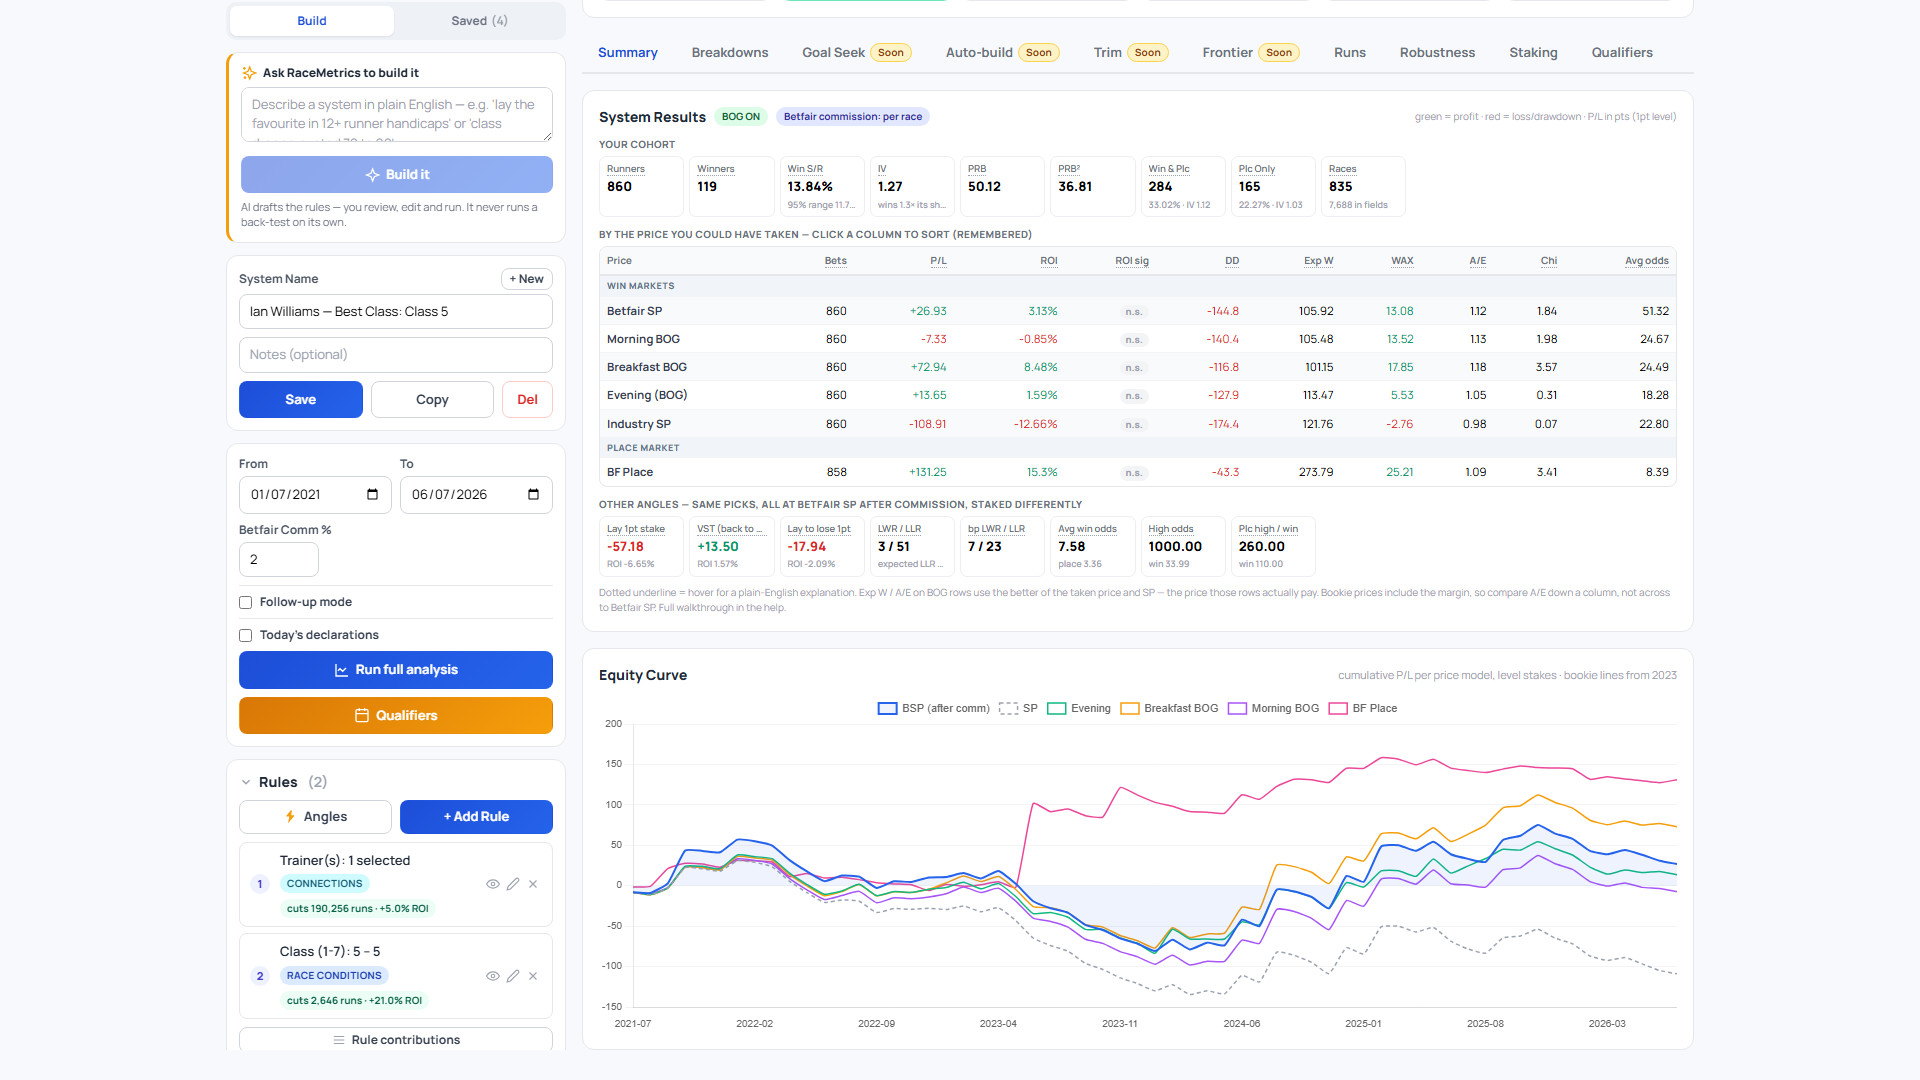
Strip 1 — your cohort (the picks themselves, before any price)
- Runners / Winners — how many runs matched your rules, and how many won. Your sample size — bigger is more trustworthy.
- Win S/R — out of every 100 picks, how many won. The small range underneath (e.g. "95% range 18.5–30.5") is the honest version: with a small sample the true strike rate could be anywhere in that range. More runs, tighter range.
- IV (Impact Value) — your picks' win rate compared with the average runner in the races your picks actually contested — not the whole report. 1.0 = winning exactly their share; 2.18 = winning 2.18× their share. (See the note below for why that denominator matters.)
- PRB / PRB² — of every 100 rivals, how many your picks finish in front of, win or lose. Above 50 = generally running well. PRB² is the same idea with extra credit for winning easily and less for sneaking a place.
- Win & Plc / Plc Only — the each-way picture: won-or-placed, and placed-without-winning, each with its strike rate and its own IV.
- Races — how many races your picks came from, and how many runners those races contained in total (that's exactly what IV compares against).
Strip 2 — the price matrix (one row per price you could have taken)
Rows are grouped into Win markets (Betfair SP, Morning BOG, Breakfast BOG, Evening, Industry SP) and the Place market (Betfair Place). Click any column heading to sort — your choice is remembered. Every row answers the same questions:
The Evening, Breakfast BOG and Morning BOG rows are settled the way a bookmaker settles them. When a horse is withdrawn after the price was taken, the winnings lose the Rule 4 deduction for it (from August 2018), and BOG then pays the better of the reduced price and the SP. A dead heat pays part of the stake at full odds, at every price including Betfair SP. The panel shows how often it happened: a price tile reads R4 on 3 when the deduction came off three winners (hover it for the sentence), the System Results table says the same under each price, and the Betfair SP and SP rows count any dead-heat winners. In the Runs list, tick Rule 4 and Dead Heat under Market in the columns to see the deduction on each race.
The System Performance panel at the top of the results shows a quick chip for each of these prices too — plus DOB and TROB chips settling the very same bets as the in-running Double Or Bust / Treble Or Bust trade, with the hit rate shown against its break-even. Those two are back-test only (an in-running price exists only after the race is run), they sit outside the "best price" highlight because a flat-payoff trade isn't comparable with a back bet, and the full detail lives on the Staking tab.
Hindsight prices. If your system has a rule that is only known at the off or later (the rules with the amber warning mark in your list, such as BSP Rank, SP Rank or Favourite Status), the Evening, Breakfast BOG and Morning BOG figures are marked hindsight: greyed in the panel, tagged in this table and in the Equity Curve, greyed in every breakdown table, and never given the "best price" highlight. That rule picked the runners using something the earlier prices never knew. A horse that ends up Betfair favourite has usually shortened, so its evening price was bigger, and "BSP Rank = 1" can look well in profit at the evening price while losing at Betfair SP. The figures are still there for research; they are just not prices you could have taken. Betfair SP, Betfair Place and Industry SP are settled at the off, so they are not marked (though a rule on the result itself, such as Finishing Position, is hindsight at every price). Follow-up mode backs the horse's next start, after the qualifying race, so nothing is marked there.
A rule on a later price counts too. The three bookmaker prices are taken at different times: the evening price at 8.30pm the day before, the breakfast price at 7.30am and the morning price at 10.30am. A rule on the morning prices (Morning Price, Morning Price Rank, Morning Shortening / Drift vs Evening, Market Shape and the like) makes the Evening and Breakfast BOG figures hindsight, and a rule on the breakfast prices makes the Evening figure hindsight. The price the rule itself uses, and any later one, is left alone. "Morning shortened 20%+ vs evening" picks the horses that went on to be backed, so from 2023 it shows about +34% at the evening price while losing about 6% at the morning price you could actually have taken.
- Bets / P/L / ROI / DD — how many picks had that price, the points won or lost at 1pt level stakes, that as pence-in-the-pound, and the deepest losing hole along the way (drawdown).
- Exp W (expected wins) — ask the prices themselves: "if these prices were exactly right, how many winners should there be?" A 3/1 shot should win 1 time in 4, so it contributes ¼ of a win; add them all up. BOG rows use the price they actually pay — the better of the price you took (less any Rule 4 deduction) and the SP. Took 10/1 in the morning, SP 12/1? That runner counts as 1/13th of a win, because 12/1 is what you were paid at.
- WAX — Winners minus Exp W. Positive = more winners than the prices predicted.
- A/E — Winners ÷ Exp W. Above 1.00 = your horses win more often than that market's prices say — you're beating that market. Below 1.00 = the market has their measure.
- Chi — "could that win-count gap just be luck?" A low number means it easily could. 4+ = probably real, 5+ = very probably real. (It needs at least 5 expected wins to be meaningful, so tiny samples show a dash.)
- ROI sig — a different luck test. Chi checks the win count; this checks the money. Betting P/L bounces around a lot, so it asks: is the profit or loss big enough, given the bounce, to be believed? n.s. = could easily be luck; 95% / 99% = probably real. A system can pass one test and fail the other — a real edge should eventually pass both.
- Avg odds — the average decimal price you took in that market.
Strip 3 — the four staking angles (all at Betfair SP, after commission)
The same picks, played four ways. Reading them together tells you how the system wins or loses:
- Back — level 1pt (the Betfair SP row above) — the headline.
- VST (back to win 1pt) — a smaller stake at bigger prices, sized so every winner pays exactly +1pt. If level stakes profit but VST doesn't, a couple of big-priced winners are carrying the system; if both profit, the edge is spread across the price range.
- Lay 1pt stake — play bookie: take a 1pt bet on every pick. Winners cost you their odds; losers pay you 1pt.
- Lay to lose 1pt — play bookie, sized so any winner costs exactly 1pt. Steady small collects with no blow-ups — the laying mirror of VST. If your system's picks are bad value, these two lay lines are where that shows as profit.
Alongside them: LWR / LLR — the longest winning and losing runs. For one-pick-per-race systems an expected LLR appears beside it: what a normal worst run looks like for that many picks at that strike rate. If your actual LLR is near the expected figure, nothing is wrong — losing runs of that size are simply what the maths says will happen.
Why our IV is the honest one
Most Impact Value calculations quietly get this wrong: they divide by the runner share of every race in the report, when they should divide by the share in the races your sample actually contested. A worked example over 15 five-furlong races (127 runners): stall 8 ran in only 9 of them — 9 runners out of the 91 in those 9 races — and won 2 of the 9. The lazy calculation gives 22.2 ÷ 11.8 = 1.88. The correct one gives 22.2 ÷ 9.9 = 2.25, because stall 8's 9 races (with their bigger fields) are what it actually faced. The Summary IV here uses the correct, contested-races denominator. Breakdown-table IVs use a close cousin — wins ÷ the exact equal-chance expectation in each field faced — which answers the same independent-events question, weighted race by race.
You don't need all of it at once: the Betfair SP row's A/E and ROI tell most of the story, and the drawdown and streak figures tell you what living with the system would feel like.
The equity curve
The chart shows how a £1-level-stakes bank would have grown bet-by-bet. A smooth climb is healthier than a jagged one even at the same end profit — it means fewer gut-wrenching losing runs. Toggle the price lines (BSP / SP / bookie) to compare.
A back-test gives you one overall number. A breakdown splits that number across a single dimension — by class, by distance, by going, by month, by course, by trainer — so you can see where your system works and where it's quietly losing.
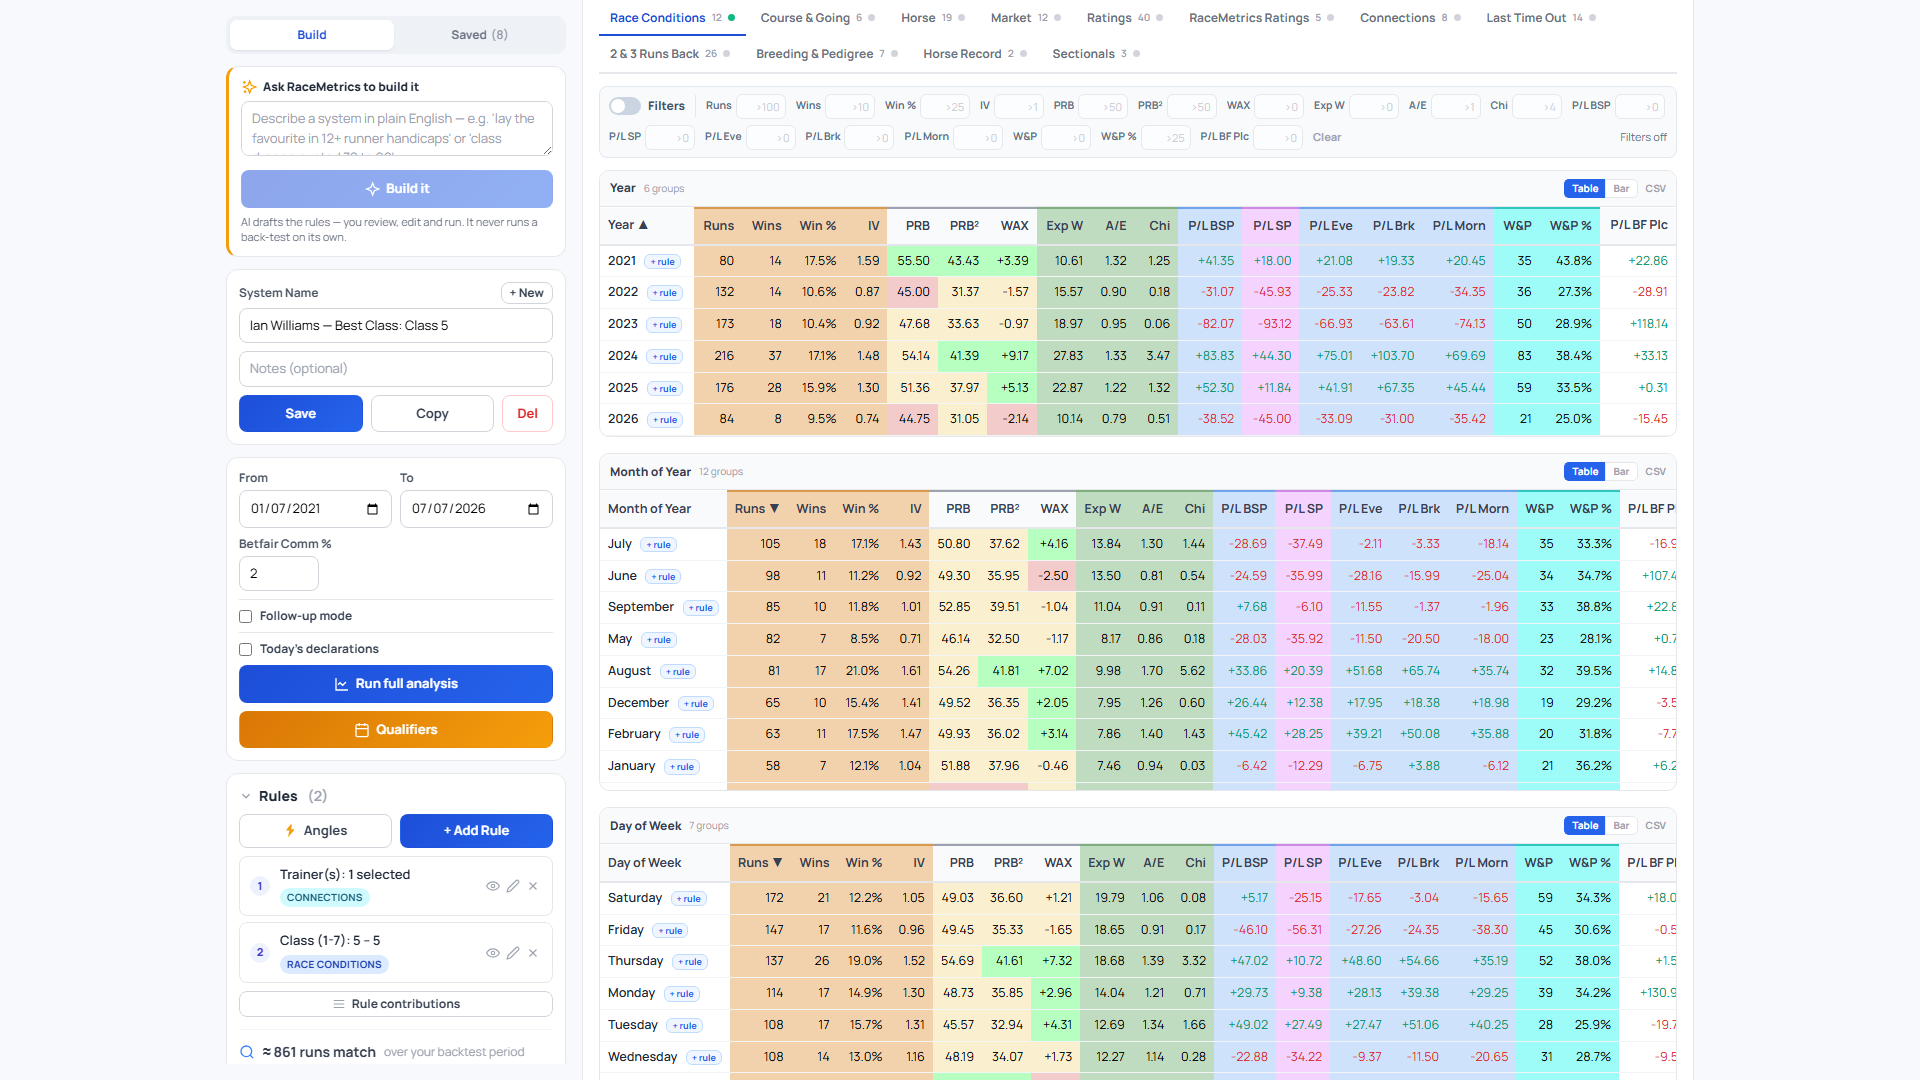
There are over 150 breakdowns, so the panel organises them into category tabs — Race Conditions, Course & Going, Horse, Market, Ratings, RaceMetrics Ratings, Connections, Last Time Out, 2 & 3 Runs Back, Breeding & Pedigree, Horse Record and Sectionals — and only computes a category when you open its tab. After a run, just the equity chart and the tab you're looking at are calculated; everything else waits until you ask for it. That keeps runs fast, and means you're never waiting for tables you weren't going to read.
- Columns — every breakdown table shows the same set of stat columns, and the Columns button on the toolbar lets you choose them. Out of the box you get the essentials — runs, wins, strike rate, IV, PRB (the average share of rivals each runner beat), PRB² (the same, weighted towards dominant runs), WAX (wins above what the prices expected), Exp W, A/E and Chi — plus the P/L at every recorded price. Open the chooser and the full desktop System Results battery is there, colour-coded exactly like the desktop grid: orange for the counts (runs, wins, strike rate, IV); PRB, PRB² and WAX cells coloured by their value — green when better than 55% / 40% / +2, amber through the middle band, red when worse than 45% / 30% / −2; green for the expectation stats (Exp W, A/E, Chi); blue for the Betfair & bookie money; lilac for SP money; tan for place only; cyan for win & place; pink for the lay columns; pale lilac for VST and yellow for the odds — with the Betfair place family left plain, just as it is on desktop. Separate ROI columns are in there too if you'd rather see ROI beside P/L than hover for it. Your picks and their order are remembered, and the value filters, bar charts and CSV all follow whatever you've chosen. (Each stat is explained in plain English in the Summary panel guide.)
- Status dots — each tab carries a small dot: grey = not computed yet, pulsing blue = computing now, amber = partly computed, green = done. Open a tab and it fills itself in.
- Load all — if you'd rather have the whole picture up front, this button computes every category, one at a time.
- Drill down — click any breakdown row to open the actual runs behind that group: every horse, race, price and result that makes up the row's figures, newest first. A separate Drill columns button lets you pick from forty-plus extra fields (draw, going, class, ratings, prices, in-running highs and lows and the IR Low % / IR High % they moved against Betfair SP in-play, last-time-out details...) — your choice is remembered, drives the Runs tab's extra columns too, and CSV exports the whole drilled list with exactly the columns you chose. It's the fastest way to sanity-check a promising row: are these real, spread-out results or three lucky Saturdays?
- Search — the search box looks across all categories, not just the open tab. A match inside a tab you haven't loaded yet shows a Load button, so you can compute just that one breakdown.
- Table or Bar — toggle each breakdown between a sortable table and a bar chart. Your table-or-bar choice and sort order are remembered per breakdown.
- Hindsight columns — the evening, breakfast and morning price columns (P/L, ROI, WAX, A/E and Chi) turn grey, with a dotted heading you can hover for the reason, when those prices could not have been taken on the runners. That happens in every table when your system has a rule only known at the off or later, and for the earlier prices when it has a rule on a later bookmaker price (see Hindsight prices). It also happens in any breakdown that is itself split by something only known at the off or later, even when all your rules are pre-race: for example BSP Rank, SP Rank, the ISP and BSP bands, Fav Status, Finishing Position, Run Style, Actual Going, the in-running prices, and the My Rating a horse earned in the race (unless your scale is an imported set). A breakdown split by a later bookmaker price (Morning Price, Breakfast Price, their ranks, Market Shape) greys only the earlier prices: split by Morning Price, the evening and breakfast columns. Split by BSP Rank, the "1st" row can look well in profit at the evening price, because a horse that ends up Betfair favourite has usually shortened. The figures stay for research, a bar chart of one is drawn faded, and the CSV heads those columns "(hindsight)". Betfair SP, Betfair Place and SP are settled at the off, so their columns are never marked.
- + rule — the magic button, exactly as before. See that your system loves soft ground? One click turns that row into a "going = soft" filter on your system. It's how you go from "interesting" to a sharper system.
For the complete list of every breakdown and what it splits by, see All breakdowns.
Testing many lines at once. A Chi of 4 means about a 1-in-20 chance of a gap that big by luck, for one line. A table of 40 trainers is 40 tries, so about 2 of them reach Chi 4 with no edge at all. So whenever a Chi column is showing, a short note under each table says how many lines have a Chi, how many luck alone would put at Chi 4 or more, how many actually are, and the higher Chi a line needs once you allow for the number tried (statisticians call this the Bonferroni correction: with 40 lines the bar is about 10.4, with 100 about 12.1). Lines that clear it are in bold. The note always counts the whole table, even when a value filter is hiding rows. A line below the bar is not worthless; it just needs checking on data it was not found on, which is what the Data split and the final-12-months check are for.
Once you've built a system, the headline number tells you how it did overall — but it doesn't tell you where it did well and where it leaked money. A breakdown answers exactly that. It takes every bet your system would have made and splits the results across a single dimension — for example, by going, by month, by age, or by trainer — and shows you a separate row of figures (runs, wins, strike rate, profit/loss, A/E) for each value of that dimension.
Think of it as slicing the same cake in different directions. The same set of qualifying runners, re-sorted so you can see, say, that your system makes a healthy profit on Good ground but loses heavily on Soft — something the single overall figure completely hides. (A quick jargon note: strike rate = the percentage of bets that won; A/E = "Actual over Expected", which compares how many winners you actually got against how many the betting market's prices implied you should have got — above 1.0 means you're beating the market.)
Every breakdown row has a "+ rule" button. Click it and the System Builder turns that single row straight into a filter on your system. So if the By Going breakdown shows Good ground is where all your profit comes from, one click adds a "Going is Good" condition — no need to go back and build the filter by hand. This is the fastest way to refine a rough idea into a focused, profitable system: build broad, break it down, then "+ rule" the rows that work.
And clicking anywhere else on a row drills down into it — a table of every individual run behind that group, with a column chooser and CSV export. Numbers persuade; the actual runs convince.
The breakdown tables have their own column chooser too, and it includes an In-running (DOB / TROB) group: P/L DOB, ROI DOB, DOB Hit % and DOB Bets, plus the same four for TROB. Tick those and every breakdown row also tells you how the trade settled — so you can ask which sire, which trainer, which going or which distance actually halved its price most often, instead of only seeing the one number for the system as a whole. The drill-down adds matching DOB Hit and TROB Hit columns, Y or N on each individual run (blank where the price was too short for the lay leg to be possible at all), so a listing reconciles line by line with the percentage above it.
The breakdowns below are grouped exactly as the tabs in the Breakdowns panel group them, in the same order. A few are marked as Sectionals add-on — these need the optional Sectionals data subscription, because they're built from in-race timing data that not every customer has (without it, the Sectionals tab simply doesn't appear).
Race Conditions
These split your results by the conditions of the race itself, or by when it was run — useful for spotting seasonal patterns or working out which grades and race shapes suit your angle.
- Year — splits by the calendar year of the race, so you can see whether your edge is holding up over time or fading. A genuine angle shows profit spread across most years, not one bumper season propping up the total. If recent years have drifted to break-even or worse, treat the headline ROI as historical — the market may have caught up — and lean on the holdout test before backing it live.
- Month — splits by month number (a simpler grouping than the seasonal one below); this is the split that powers the equity chart, so it doesn't appear as a card. Read it through the chart instead: a steady upward line beats one giant spike, and long flat or falling stretches tell you how many losing months you would have had to sit through — a practical test of whether you could actually follow the system.
- Month of Year — splits by named month (January through December), so you can read off the calendar at a glance. Months proxy the racing calendar — the turf season opening and closing, the core winter jumps campaign, the big festivals — so profitable months should cluster in adjacent blocks with a calendar explanation. One golden month surrounded by losers is noise; a run of them that matches the Season split is a pattern worth restricting the system to.
- Week Number — splits by the Monday-to-Sunday week of the year, 1 to 53, a finer grain than Month of Year. Its real use is in the Grid: put Week Number down the rows and Year across the columns and you get the whole record week by week, season against season, in one table — the view people used to build by exporting to a spreadsheet. Read it the way you read months: a block of adjacent good weeks with a calendar reason behind it (a festival, the turf season opening) is worth something, a single spectacular week is not. Week 1 is the week holding the first Thursday of January, so a race on 1 or 2 January can sit in the week 52 or 53 row.
- Season — groups into Spring, Summer, Autumn and Winter — handy for angles that only fire in, say, the turf summer. The coarser buckets carry more runs than the month split, so a seasonal difference here is more trustworthy than a single hot month. Just check it is genuinely seasonal: winter profit is often a jumps or all-weather edge in disguise, and the Race Type split will tell you which is really doing the work.
- Day of Week — splits Monday through Sunday — some systems work better on busy weekend cards, others on quieter midweek meetings. There is a real mechanism here: Saturdays carry the competitive, well-bet handicaps while midweek cards are weaker and more thinly traded. Demand that story before acting, though — a system that only wins on Tuesdays with no card-quality explanation is over-fitting by another name, and this is one of the easiest tables to fool yourself with.
- Time of Day — groups by the race's off-time (e.g. early afternoon vs evening), which can matter for things like fading light or all-weather evening cards. Time of day is rarely an edge in itself — an evening bucket that outperforms is usually the all-weather or low-grade card profile showing through, so cross-check the Race Type and Class splits before crediting the clock. If they confirm it, act through those filters rather than the time slot; if not, treat it as noise.
- Class — splits by the race's official class (1 = highest quality down to 7), telling you whether your edge lives in top-class or low-grade racing. Class often restates the Race Value split, so check the two tables agree before trusting either. If profit concentrates in a couple of grades on healthy runs and A/E, a class filter is a sensible refinement; if a single class carries everything on a handful of wins, that is fitting, not finding.
- Race Type — splits by code: Turf (flat), A/W (all-weather flat), Chase, Hurdle, NHF (National Hunt Flat / bumpers). Flat and jumps are close to different sports, so an angle that wins on one code while bleeding on the other usually deserves a race-type filter rather than the benefit of the doubt. Be wary of the NHF row — bumper samples are typically small, and a strong figure there rarely rests on enough runs to act on.
- Distance — splits by distance band (e.g. sprint trips vs staying trips), so you can see which trips your selections handle. Look for a gradient — strike rate rising or falling smoothly as trips lengthen suggests a real trip effect worth converting into a distance filter. A single profitable band sandwiched between losing ones is the classic over-fit shape: there is rarely a racing reason a system works at one trip but fails either side of it.
- Field Size — splits by how many runners lined up — many angles behave very differently in small fields versus big competitive ones. Strike rate falling as fields grow is normal and tells you nothing on its own, so judge these buckets on ROI and A/E instead. If your profit sits in big fields, expect longer losing runs and size stakes accordingly; if it lives in small fields, check the prices are still big enough to survive commission.
- Handicap? — a simple two-way split: handicap races (where horses carry weights set to equalise them) versus non-handicaps. The two reward different things — handicaps are competitive puzzles among exposed horses, while non-handicaps are often settled by raw ability at short prices — so many form angles only work in one of them. With just two buckets the samples are usually large, making a clear gap here one of the safest findings to promote straight into the handicap filter.
- Race Value — splits by prize-money band, a rough proxy for how important and competitive the race is. Valuable races draw the sharpest markets, so an A/E that survives in the top bands is strong evidence the edge is real rather than a pricing error; profit confined to the cheapest races is still bankable but leans on weaker, less reliable form. Compare against the Class split — where the two tables disagree, the thinner samples are usually the ones lying.
- Going Adjustment — splits by Proform's ground-softness scale ("GA") mapped to named going: on turf roughly <=-15 = extremely bottomless, around -1 to +2 = Good, +3 and up = Firm; on all-weather below 0 = Slow, 0–2.99 = Standard, 3+ = Fast — a more precise read on underfoot conditions than the official going word. A smooth drift in strike rate from firm towards soft is a genuine going bias worth writing in as a rule; the extreme buckets are rare, so don't hang everything on one profitable mud row.
Course & Going
These split by where the race was run and the ground it was run on — the bedrock of a lot of profitable angles, since horses (and systems) are often course- and ground-specific.
- Course — splits by racecourse — the classic way to find that your system thrives at one track and dies at another. Course rows are also where over-fitting is easiest: with dozens of tracks in the table, a few will show profit by chance alone, so ask why before acting on any of them. If the strong courses share a trait — sharp, galloping, all-weather — confirm it on the Course Shape or Surface split and filter on the characteristic rather than the postcode.
- Going — splits by the official going (Firm, Good, Good To Soft, Soft, Heavy, Standard, etc.) — the ground description published before the race. A smooth gradient — strike rate improving as the ground eases, say — is far more believable than one winning going flanked by losing neighbours, which usually points to a thin sample. Extremes such as
HeavyandFirmcome up rarely, so cross-check any edge there against the Actual Going split before committing to a going filter. - Actual Going — splits by the returned going recorded after racing, which sometimes differs from the official forecast — use this when you want the ground the horses really ran on. Compare it with the official Going split: if the edge sharpens here, ground genuinely drives your system rather than the description of it. Bear in mind the returned going is only known after the race, so on the day you still act on the official description — treat this split as confirmation, not a bettable filter.
- Surface — splits Turf from the specific all-weather surfaces (Polytrack, Tapeta, Laytown) — useful for all-weather specialists.
PolytrackandTapetaride differently, and plenty of angles work on one but not the other, so treat them as separate propositions rather than a single all-weather bucket. Each artificial surface covers only a few courses, so a surface edge may really be a course edge — check the Course split before deciding which filter to add.Laytown's beach fixtures are too rare to read anything into. - Course Direction — splits left-handed tracks from right-handed ones — some horses and angles strongly favour one way of going round. With only two big buckets the samples are usually large enough to trust, so a clear gap in results between the halves is worth taking seriously. Pair it with the Course split, though: if most of your left-handed runs come from one or two tracks, the direction effect may just be a course effect in disguise.
- Course Layout, Track Type, Direction, Gradient and Gradient Profile (course and trip) — results by the course and trip actually run, from the course maps; races the maps cannot place are Unknown.
- Number of Bends, Distance to First Bend, Rise or Fall (Flat), Height Range, Home Straight, Climb in Home Straight, Circumference and Finish (jumps) — the same in bands; each row adds back as the matching rule.
- Horse / Trainer / Sire PRB % on Similar Tracks, on Today's Track Type, on Today's Gradient (and, for the horse, direction, bends, rise or fall and climb) — results by that record, in 10-point PRB bands, with "No such runs" on its own row.
- Course Shape — splits by the physical character of the track (e.g. galloping, sharp, stiff, undulating, easy), which suits different running styles. This is the split that turns a course hunch into something transferable: if your angle favours prominent racers, it should hold across the sharp tracks as a group, not just at one of them. Where a character bucket outperforms consistently, filtering on the trait travels far better than hard-coding a list of courses.
- Course Nation — splits by the home nation of the track: England, Scotland, Wales, Ireland (the whole island) or UAE. The quickest way to see whether an angle travels — a system built on English form that falls apart in Scotland is telling you something about the tracks, not the horses. Click a row to add it as a Course Nation rule.
Horse
These split by attributes of the individual runner — age, weight, draw, layoff, breeding-free physical traits and recent form signals. Great for narrowing a system down to a horse profile that consistently delivers.
- Age — splits by the horse's age in years. Age interacts strongly with race code — flat systems often skew towards progressive three-year-olds while jumpers peak later — so read this alongside the race-type picture. A strike-rate slide as age rises usually means your angle is really catching unexposed improvers; if so, an age cap is a legitimate refinement, but be wary of trimming to a single profitable age on a thin sample.
- Draw — splits by stalls draw band (low, middle or high). On flat tracks with a draw bias this can be where a whole edge lives, particularly at sharp turning courses over shorter trips. If one band carries virtually all the profit, cross-check the course breakdown: a genuine draw edge is course-specific, so profit tracing to a couple of known biased tracks is believable, while a bias spread evenly across every course is more likely noise.
- Draw (stall) — splits by each individual stall number (flat races; jumps runners collect in a
No drawgroup). The banded Draw split answers "low, middle or high?"; this one answers "which stall exactly?" — useful because a real bias often lives in one or two stalls against the rail rather than a whole third of the field. High stalls only occur in big fields, so the outer rows thin out fast — read the runs column before celebrating a profitable stall 15. - Days Off — splits by how long since the horse last ran — its layoff — separating fresh, well-rested runners from quick-backup and long-absence types. A strike-rate cliff at the long-absence end is common and often worth a days-off cap; profit concentrated in quick backups can instead signal trainers striking while a horse is in form. Pair any layoff pattern with the trainer split, since fitness first time out is very much a stable-specific skill.
- Headgear — splits by the headgear worn — blinkers, cheekpieces, visor, hood, tongue strap and so on — grouped by the first matching aid, with blinkers taking precedence in compound codes. Headgear buckets are usually small next to the bare-headed group, so demand a decent run count before reading anything into one. Remember it shows what was worn, not whether it was fitted for the first time: a habitual visor-wearer and a first-time gamble are very different propositions.
- Run Style — splits by how the horse ran on the day: led, prominent or held up. This is recorded after the race, so it is a research split rather than something known beforehand. If nearly all the profit comes from horses that led, your system is pace-dependent — results will swing on how races unfold — so look at the horse's habitual run style pre-race as a proxy, and expect leaner spells when your types get taken on for the lead.
- Colour — splits by coat colour — bay, chestnut, grey and so on. Mostly a curiosity, though it occasionally surfaces a quirk worth a second look. Its best use is as an over-fitting alarm: colour has no plausible causal link to performance, so if a "profitable greys" bucket tempts you to add a filter, you are curve-fitting noise — and it is a handy benchmark for how convincing a random split can look.
- Weight Carried — splits by the weight band the horse carried, in pounds. In handicaps weight is a proxy for ability — the burden and the class signal are entangled — so a profitable high-weight band often means your system likes well-handicapped, better-class horses rather than the weight itself. Read it alongside the Weight Rank split: rank strips out the differing weight ranges between race types and shows whether relative or absolute weight is doing the work.
- Finishing Position — splits by where the horse actually finished — a research-only split, since you cannot know the finish in advance, but revealing about how the cohort performed. A pile-up of seconds and thirds behind a modest win count suggests the angle finds live horses that get outgunned late, which makes each-way or place staking worth testing. A heavy tail of well-beaten runs instead points to entry rules letting out-of-form horses through.
- Distance Travelled — splits by how far the horse travelled from its stable to the course. Long-haul runners are sometimes a profitable — or unprofitable — niche: trainers rarely put a horse on the box for a long trip without intent, so a long-distance bucket that holds up over a respectable sample is a believable signal rather than a quirk. Check the trainer split too, since a handful of raiding yards can account for most of a travel-band edge.
- Career Runs — splits by how many times the horse had run before today, counted point-in-time so it reflects experience at the moment of the race, separating unexposed newcomers from hardened veterans. Profit clustered in lightly raced horses usually means the handicapper or the market has not caught up with them yet — a genuinely repeatable kind of edge. Fully exposed veterans hold few secrets, so a profitable high-runs bucket deserves more scepticism and a bigger sample before you trust it.
- Ran-Well-In-Running % — splits by a "hidden improver" signal: the percentage of the horse's prior priced runs where its in-running price traded at least halfway in from its Betfair SP, or where it won. Top bands are horses repeatedly getting into strong positions in running that the bare result hides — exactly what the market is slowest to reprice. Because it is built from prior priced runs, lightly raced horses carry lumpy percentages, so judge a high-band edge on run count before promoting it to a filter.
- Recency Speed Trend — splits by whether the horse's recent (last 90 days) average speed figure sits below, level with or above its career average at this race code: declining, steady or improving. Profit living in the improving bucket means the system is riding an upward form curve — a healthy sign you can lock in with a rule. A profitable declining bucket is more interesting than it looks: it can mean the market over-punishes a couple of poor figures, but insist on a solid sample first.
- Sex — splits by the horse's sex: gelding, filly, mare, colt, entire horse or rig. Sex patterns often echo your race mix rather than a real signal — geldings dominate the jumps population, colts and fillies the juvenile ranks — so check the race-type picture before crediting the sex itself. Where a fillies or mares bucket does stand out, ask whether the wins came against their own sex or in open company; the latter is a much stronger statement.
- Horse Career SR % — splits by the horse's career win strike-rate going into the race, banded, with horses yet to win forming their own group. The market prices proven winners efficiently, so the higher bands usually need A/E rather than raw strike rate to show anything — a high-SR band winning often but losing money is the classic sign the edge is already in the price. The winless group repays attention in maiden-heavy systems, where it separates improvers-in-waiting from serial placers.
- Weight Rank — splits by the horse's rank in the race on weight carried, where 1 is the top weight. Within a handicap that rank is effectively a class ranking — the top weight is the horse the assessor rates best — so profit at rank 1 usually means your angle thrives on class standing out in weaker company. It pairs naturally with the Weight Carried split: rank tells you about relative standing within the race, the band about the absolute burden.
- Penalty — splits by any weight penalty carried, for example for a recent win. A penalised runner is by definition in form but racing before the handicapper has fully reassessed it, so a bucket that stays profitable under a penalty is picking out horses genuinely ahead of their mark. Penalty carriers are a small minority of most systems, though, so expect thin buckets and lean on A/E rather than raw profit before drawing conclusions.
- Jockey Claim — splits by the rider's weight allowance — the apprentice or conditional claim. A claim trades weight off the horse's back against rider inexperience, and this table shows which side of that trade your system sits on. When the profit lands with claiming riders it often reflects shrewd yards booking in-demand young riders — an intent signal worth pairing with the trainer and jockey splits — while a collapse at the largest allowances is inexperience biting, and points to capping the claim.
- Horse — splits by the individual horse, showing which runners drove the results. This is the concentration check every backtest needs: if two or three horses supply most of the profit, you have found a short string of good horses rather than a repeatable rule, and the edge leaves when they do. Mentally strip out the top contributors and ask whether the remainder still pays — if not, treat the system as a tracker list, not a betting rule.
Market
These split by the betting market — price band and favouritism. Often the single most powerful dimension, because price drives profit: the same selection method can be a goldmine at one price band and a money-pit at another.
- ISP Band — splits by Industry Starting Price band (the official bookmaker SP) — the standard way to find your system's profitable price range. Almost no angle pays across the whole market, so the real question is which bands carry the profit. A band holding A/E above 1 on a proper sample is a genuine candidate for a price rule; one propped up by a single big-priced winner is noise, so check how each band's profit is actually made before promoting it.
- Price Ratio SP / Price Ratio BSP — splits by the Price Ratio (decimal odds ÷ field size) in six bands from under 0.30 to 1.50+. Unlike a raw price band, the same band means the same market strength in a 5-runner race and a 20-runner one — so this is the cleaner way to find which market positions your angle actually pays at. Any profitable band is one click from becoming a rule.
- Fav Status — splits by market rank: favourite, joint favourite, second favourite, and so on — telling you whether your edge is in the well-backed runners or the bigger prices. Favourites win far more often than anything else, so a fav-heavy bucket can post a handsome strike rate while still losing money; judge each group on ROI and A/E, not raw wins. If the profit sits away from the head of the market, back the finding up with a price rule rather than the label alone.
- BSP Band — splits by Betfair Starting Price band, shown net of stake (odds-to-1) — the exchange equivalent of ISP Band, and usually a fairer reflection of true price. Read it alongside ISP Band: profit that only shows up here means the exchange is beating the bookmaker price on your runners, a case for placing the bets on Betfair. Treat the longest bands with scepticism, as one big BSP winner can carry a bucket's figures for years.
- BF Place SP Band — splits by Betfair Place SP band, net of stake (odds-to-1), showing how the place market rates your qualifiers — useful if you're thinking about place or each-way betting rather than win-only. Runners bunched in the short place bands are horses the market expects to hit the frame even when they cannot win. If a band looks promising, re-run the system under the Each-Way option on the Staking tab before committing money to place betting.
- SP Rank — splits by market rank on Starting Price (1 = shortest). SP is only known after the off, so this is a back-test research split, never a live qualifier rule. Strike rate should decline smoothly as rank rises; a bucket that breaks the pattern on a respectable sample points to a market blind spot worth understanding. Because you cannot filter on SP rank pre-race, translate any finding into the nearest actionable proxy — an evening- or morning-price band — rather than the rank itself.
- SP Rank (exact) — the same market ranking with every individual rank as its own row (1st = the favourite, then 2nd, 3rd, right down through the field) instead of the bands above. Use it when the banded view hides the detail you care about — say, whether second favourites behave differently from third favourites in your system. As with any fine split, the deeper ranks carry few runs, so lean on the banded version for conclusions and this one for the microscope. Post-race data.
- BSP Rank — splits by market rank on the Betfair SP — Favourite, 2nd-3rd, 4th-6th, 7th-10th and 11th+ — the exchange's answer to the SP Rank split. BSP is only set at the off, so this is back-test research rather than a live qualifier rule. Because exchange prices are made purely by money rather than a bookmaker's margin, a rank pattern that holds here as well as on SP Rank is the real market speaking; where the two disagree, the exchange version is usually the fairer read on how fancied your runners truly were.
- BSP Rank (exact) — the same Betfair SP ranking with every individual rank as its own row (1st = the exchange favourite, then 2nd, 3rd, down through the field), plus an Unknown group where no BSP rank exists. Use it as the microscope when the banded view flattens the detail you care about — say, whether the exchange second favourite behaves differently from the third. The deeper ranks carry few runs each, so draw conclusions from the banded split and inspect them here. Post-race data.
- SP Rank Move vs LTO — splits by how the horse's market rank shifted since its last run: Shortened 3+ or 1-2 ranks, Same rank, Drifted 1-2 or 3+, with debutants in a No LTO rank group. It reads market confidence across two races — a horse moving up the betting order is one the market likes more today than it did last time, whatever the raw prices were. Profit among the shorteners means your system agrees with fresh market support; profit among the drifters is the more interesting find — an angle backing horses the crowd is walking away from. Needs today's SP, so it's post-race research rather than a qualifier rule.
- In-Running Low — splits by the lowest price the horse traded at in running on Betfair (decimal), banded. Post-race data, so it is for studying a cohort rather than finding live qualifiers. Losers who repeatedly trade very short in running are getting into winning positions and failing to finish the job — a sign the system finds the right races but the wrong result, and raw material for in-play trading or back-to-lay research instead of straight win backing.
- In-Running High — splits by the highest price the horse traded at in running on Betfair (decimal), banded — again post-race research data. Winners that spiked to big in-running highs were nearly beaten, so a system whose wins cluster in the higher bands is winning ugly, and its strike rate may not hold up. Wins that never drift far are the healthier picture; the volatile version is better exploited through trading strategies than by expecting the escapes to keep coming.
- In-Running Low vs BSP — splits by how far the in-running low traded below the Betfair SP — the "should have won" signal — banded. Post-race data, and the core split for hard-luck research: losers in the deepest bands were matched at a fraction of their BSP mid-race and still got beaten. A cohort heavy with near-misses may simply be unlucky and due to even out, but beware front-runners who always trade low before being swallowed — read the in-running comments before crediting misfortune.
- Evening Price — splits by the bookmaker's decimal price the evening before the race, banded; recorded from 2018. It is the earliest of the price snapshots and, unlike the in-running splits, genuinely knowable before the off. If a band pays here but the same runners lose at SP, your qualifiers shorten overnight and the edge lives in the early price — take it that evening rather than waiting for the market to correct.
- Breakfast Price — splits by the bookmaker's decimal price at around 7:30am on race day, banded; recorded from 2018. This is the first race-day read on your qualifiers — line it up against Evening and Morning Price to see when the market moves against you. A band that is profitable at breakfast yet loses at SP has its value stripped through the day: bet early, and the Breakfast BOG return in the summary shows what that discipline was worth.
- Morning Price — splits by the bookmaker's decimal price at around 10:30am on race day, banded; recorded from 2018. The latest of the three recorded prices, and the closest to what a casual morning punter actually takes. If profit that existed in the Evening and Breakfast bands has thinned out here, the market absorbs your edge through the morning — take earlier prices. Where the morning bands still pay, the angle is robust enough to play without setting an alarm.
- Evening Price Rank — splits by the horse's rank on the evening-before price, worked out live within each race: 1st = the overnight favourite, every rank its own row, with unpriced runners (and races before 2023, when price recording starts) in an Unknown group. Unlike the SP Rank splits, this market position is knowable the night before — so a paying rank here converts straight into a bettable, qualifier-legal rule via "+ rule". Compare it with SP Rank: profit that shows at the overnight rank but has faded by SP means the market catches up with your runners overnight, and the edge belongs to whoever bets early.
- Breakfast Price Rank — the same live per-race ranking on the ~7:30am price (1st = the breakfast favourite; Unknown for unpriced or pre-2023 runners). It shows where your qualifiers stand at the first race-day read of the market. Set it against the Evening and Morning Price Rank splits to watch your runners climb or slide through the betting as the day unfolds — an angle whose profitable ranks hold at every snapshot is far more robust than one that only pays at a single moment in time.
- Morning Price Rank — the live per-race ranking on the ~10:30am price (1st = the morning favourite; Unknown for unpriced or pre-2023 runners). This is the last market position you can act on before racing starts, which makes it the natural companion to the SP Rank research split: if the profitable SP ranks show up here too, the edge is playable in the morning market; if they don't, it only exists at the off and no bookmaker will hand it to you. A paying rank is one "+ rule" click from a live condition.
Ratings — value bands
These split by the ratings figures themselves, letting you see how your system performs across higher- and lower-rated runners.
- Official Rating — splits by the BHA official handicap rating band ("OR"), the mark the handicapper has assigned the horse. In effect a class ladder: an angle that pays only among lower-rated handicappers is a different bet from one living at the top of the ratings, so check the edge holds at the grades you would actually bet. A single profitable band flanked by sharply negative neighbours is more likely curve-fitting than signal — a smooth gradient across bands is far more believable.
- OR vs Race Average — splits by how far each horse's official rating sits from the average of its race: 10 or more below, 5 to 9.9 below, 2 to 4.9 below, within 2, and the same steps above. It reads a horse's mark against the field it actually meets, which the plain Official Rating bands cannot. Compare the returns at the early prices (Evening, Brk BOG, Morn BOG) with Betfair SP: where they differ, the market moved between the two.
- Power Rating — splits by Proform's Power Rating band, their headline overall ability figure (technical note: the Power Rating is held in the
HIR_UserRating10field). Read it with the Power Rating Rank split — the band gives the absolute class of horse your system catches, the rank shows how it stands against today's rivals. If only the top bands pay, the angle is really a class angle and is better expressed as a Power Rating filter than left implicit. - Tissue Rating — splits by the Proform Tissue rating band. Use it to see whether your system sides with the tissue or profits against it: strong returns in the highly rated bands mean your rules and the tissue agree, and a matching Tissue filter or rank rule could sharpen the system. Profit confined to the weakly rated bands rests on horses the tissue marked down, so demand a much larger sample before acting on it.
- Pace Rating — splits by the Proform Pace rating band (early speed / run style). Front-running bias is among the most persistent edges in racing, so profit concentrating in the high-pace bands is a credible finding — though early speed pays far more at some courses than others, so check which tracks supplied the winners. If returns come from low-pace hold-up types instead, be more sceptical: those wins depend on race shape falling right and are harder to repeat.
- PFR — splits by the Proform PFR rating band. Here the shape matters more than any single row: strike rate and A/E improving broadly as the band rises says the figure carries real signal for your cohort, while one profitable band sandwiched between losing ones is the classic over-fitting trap. If the top bands do the work, express it deliberately with a PFR filter, or switch to the PFR Rank split to see the same idea relative to each field.
- Stats Rating — bands the composite Stats Rating, showing the same figures as the matching filter. Because it is a composite, read it alongside the separate Trainer, Jockey, T/J and Horse Stats splits to see which component does the work; a strong top band that dissolves at component level suggests the blend itself adds the value. A clean strike-rate gradient across the bands, rather than one profitable island, is what justifies a minimum-rating rule.
- Trainer Stats — groups runners by the Trainer Stats rating (0–100), banded. Trainer form is heavily advertised, so the market usually prices strong yards — demand that profit in the high bands holds up at the odds rather than riding a strike-rate illusion before adding a floor. Watch the low bands too: runners from low-rated yards can be overlooked enough that a poor-stats band quietly outperforms its price.
- Jockey Stats — breaks the field down by the Jockey Stats rating (0–100), banded. A profitable top band often reflects meaningful bookings — connections putting a strong rider up when it counts — while low bands take in less fashionable partnerships. Rider quality correlates heavily with horse quality and price, so check the band gradient survives at similar odds before crediting the jockey; if it does, a stats floor here pairs naturally with the T/J combo split.
- T/J Stats — scores the partnership itself — the Trainer/Jockey combo Stats rating (0–100), banded — rather than either name alone. Profitable high bands can indicate trusted trainer–rider pairings that fire when it matters, but combinations accumulate runs slowly, so the extreme bands are often thin. Demand a proper sample before promoting a band to a rule, and compare with the separate Trainer and Jockey Stats splits to confirm the pairing adds anything.
- Horse Stats — turns to the horse itself — the Horse Stats rating (0–100), banded. A high band that wins often yet loses money is the classic exposed-favourite profile — the market knows these horses too — and value frequently hides in middling bands where the rating is decent but unspectacular. Whichever band profits, confirm the shape is a gradient rather than a single lucky bar before building it into a rule.
- Speed Figure (Recent Best, 1 Yr) — splits by the horse's best Proform speed figure in the 12 months before the race (today's race type only), banded. Strike rate should climb with the band almost by definition; the question is where A/E holds up, because the market prices obvious speed. A profitable top band on a solid sample suggests your other rules add something the figure alone does not; profit concentrated in the lowest bands is usually a handful of big-priced winners and deserves scepticism until the sample grows.
- Speed Figure (Career Best) — looks at the ceiling — the career-best Proform speed figure (HA), banded. High bands mean proven class, though the peak may be years old, so read this alongside the recent-average bands to separate current ability from history. Profit confined to low bands usually means your other rules operate in modest company — fine in itself, but a high-band edge that holds at the odds is the stronger foundation for a rule.
- Speed Figure (Career Median) — swaps peak for typical level: the career-median speed figure (MR), banded. A career-long median rewards consistency but drags in juvenile and early-career runs, so improvers can sit in deceptively low bands. Where the profitable band here sits well below the career-best band, you are likely backing horses capable of far better than their usual level — re-test that pattern on the last-runs average, which reacts far faster to a change in form.
- Speed Figure (Recent Median, 1 Yr) — narrows the window to the last 12 months — the recent-median speed figure (MR 1 Yr), banded — as a measure of current level. A strike-rate cliff below a particular band is a strong argument for a minimum-figure rule: horses simply not fast enough for the races your system puts them in. Set it against the career-best band too; a recent average well adrift of the old peak flags decliners, and a system profitable on those is usually living on borrowed time.
- Speed Figure (Last 3 Runs Median) — measures current form at its sharpest — the median speed figure of the horse's last three runs (MR), banded. The short window reacts quickly but is volatile: one bad figure drags the average, so borderline horses hop between bands. Profit in a single band with losses either side is fragility, not an edge; a plateau of profitable adjacent bands is the pattern that justifies tightening the matching filter.
- Speed Figure LTO — shows the Proform speed figure recorded last time out, banded. As a single, visible recent number the high bands tend to be well found in the betting and rarely generous. Profit in middling bands can mean your system catches horses ready to improve on a quiet latest effort — cross-check the 2-back and 3-back rank splits to confirm the ability is there — and be wary of promoting one thin profitable band while better-populated neighbours lose.
- PRC Average — maps the horse's PRC average rating into bands matching the equivalent filter — PRC being the Proform Race Class family. Unlike the rank split this shows absolute class level, so it reveals whether your edge is confined to one stratum of the sport: profit only in high-PRC bands marks a class-horses angle, only in low bands a bread-and-butter one. Pair it with PRC Average Rank to separate the genuinely classy from the merely best of a weak field.
Ratings — rank in race
These split by where the horse stood in the field on a rating — 1st (top rated), 2nd, 3rd and so on, every rank as its own row, plus a "No rating" group for runners without a figure. Ranks are computed live across the whole field of each race (the stored ranks in the raw data aren't reliable), and "+ rule" on a rank row adds the matching rank filter to your system.
- Power Rating Rank — splits by rank in the race on Power Rating — ranks are computed within each race, 1st = top rated, with every rank shown individually, plus a
No ratinggroup. The market prices top-rated horses accurately, so watch where A/E peaks rather than strike rate: an edge holding through the second to fourth ranks is often more bettable than one confined to the top pick. A busyNo ratingbucket means part of your cohort carries no figure at all. - Official Rating Rank — orders the field by rank on the BHA Official Rating, 1 = top rated, every rank its own row, with a
No ratinggroup at the bottom. In handicaps this doubles as a weight ladder — the top OR rank is carrying top weight — so read it alongside your handicap settings. Profit sitting with mid-ranked runners often means the system finds progressive types racing off marks below their true ability, one of the more durable angles in handicap betting. - Tissue Rating Rank — ranks the field on the Proform tissue (1 = top rated). Strong A/E in the leading ranks means your rules find horses the tissue rates highly while the market still offers a workable price — a healthy place for a system to live. If returns cluster among the low tissue ranks instead, a few winners the tissue rated poorly are probably doing the lifting; treat that as noise until the runs column builds.
- PFR Rank — ranks each runner within its race on PFR, from 1st (top rated) down through every individual rank, with
No ratingat the bottom. Rank strips out the absolute level and asks only where the horse sits against today's field — usually the sharper question in small fields, where a modest figure can still be best in the race. A clean fall-away in A/E after the first two or three ranks argues for adding a PFR rank rule to the system itself. - Pace Rating Rank — puts the field in early-speed order — the top Pace Rating rank marks the horse most likely to lead, with every rank as its own bucket and a
No ratinggroup. This is the run-style split that matters most: an uncontested leader is a famously profitable profile, so if the top rank dominates your returns, tighten the idea with a Pace Rating filter and read it against field size — the front-runner edge grows as rivals for the lead thin out. - Stats Rating Rank — places each runner by Stats Rating rank within its race, from 1st (top rated) down through every individual rank, plus a
No ratinggroup. Read it alongside the trainer, jockey and horse stats rank splits: if the leading ranks carry your profit here and the same pattern shows in those, the statistical signal is broad-based rather than one lucky component. A top rank that wins often but loses money is the market already pricing the obvious stats. - Trainer Stats Rank — ranks runners on Trainer Stats — how each horse's trainer scores statistically against the other yards represented in the race, 1 = best. Trainer form is heavily followed, so top-ranked runners are rarely underpriced on that alone; the value case strengthens when a good trainer stats rank coincides with a system built on something else entirely. If A/E actually improves in the middle ranks, your angle may work best with stables the market is ignoring.
- Jockey Stats Rank — sorts the field on Jockey Stats, the top rank going to the strongest jockey score in the race. Bookings are information — profit concentrating among the top-ranked riders is often really detecting stable intent. Before promoting it to a rule, compare it with the trainer and T/J combo stats rank splits; if the combo split is sharper, the pairing rather than the rider alone is doing the work.
- T/J Stats Rank — compares the pairings in the race on Trainer/Jockey combo Stats, rank 1 going to the best partnership. Combo stats are where intent shows: a trainer booking a rider they win with is a stronger pointer than either name separately. Sample size cuts both ways here, though — a combo record rests on fewer runs than trainer or jockey figures alone, so insist on a decent run count before trusting an outlying bucket.
- Horse Stats Rank — sets each runner's own statistical record against the field — rank in the race on Horse Stats, 1 = top rated, every rank shown individually, with
No ratingat the bottom. It rewards proven, consistent horses, so expect the top ranks to win most; the tell is A/E. Consistent horses are also obvious ones — if the top rank wins plenty yet returns a loss, this split is merely confirming class and your system's edge lies elsewhere. - Speed Career Best Rank — reaches back over the whole career — rank in the race on career-best speed figure (HA), with the top rank held by the fastest figure recorded in the field. That best may be years old, so it measures proven top-end ability rather than current form; set it against the recent-best rank to see which your winners rely on. Profit that needs the career figure but not the recent one often means horses returning to a level the market has written off.
- Speed Recent Best Rank — narrows the same HA figure to a recent window — rank in the race on the best speed figure in the last 12 months (HA 1 Yr). Recent best is the most market-visible speed measure, so strike rate will flatter the top ranks; the split earns its keep where A/E survives on a real sample. A cliff after the first rank or two is a cue to hard-code a speed-rank rule; a flat profile says speed is not what your system trades on.
- Speed Career Median Rank — swaps best for typical — rank in the race on career-median speed figure (MR), 1 = the highest lifetime median in the field. Medians reward consistency over flair, so this rank favours solid, exposed types rather than one-run wonders — a useful counterweight to the career-best rank, which a single freak figure can distort. If your profit tracks the average rank more closely than the best rank, reliability rather than peak ability is the trait your system is really selecting.
- Speed Recent Median Rank — completes the speed quartet — rank in the race on the median speed figure over the last 12 months (MR 1 Yr), with every rank its own row and the usual
No ratinggroup. Of the four speed-figure ranks this is the closest to a reading of current form, since it needs a horse to be running to its level repeatedly and recently. Strong A/E at the top here against a weak career-average picture points to improvers — the profile worth a filter before the handicapper and the market catch up. - Speed Last 3 Runs Median Rank — splits by rank in the race on the median speed figure (MR) of the last three runs, computed within each race with 1 = top rated; every rank gets its own bucket, plus
No rating. Because the average smooths out one freak run, profit concentrated in the first two or three ranks points to genuinely consistent recent form. A busyNo ratingbucket holds horses without the figure — decide deliberately whether your system should keep them. - Speed LTO Rank — ranks each field on the last-time-out speed figure, 1 = top rated, every rank its own row, plus a
No ratinggroup. The latest figure is the one punters lean on most, so the top ranks are rarely underbet — profit there that holds up at the odds is a genuine find. If returns sit in the middle ranks instead, the market may be over-trusting one recent number; check the 2-back rank split before acting. - Speed 2-Back Rank — orders the field by the speed figure two runs back, 1 = top rated within the race. Its classic use is spotting horses whose penultimate effort outstrips a poor latest run — the market anchors on last time out, so strong buckets here alongside weak Speed LTO Rank buckets suggest your system profits from overlooked form. If both splits tell the same story, this one adds little you could not capture on the fresher rank.
- Speed 3-Back Rank — takes the speed figure three runs back and ranks it within each race, 1 = top rated. Three runs is deep enough that the signal fades and excuses multiply, so treat this as a supporting split that should broadly echo the fresher speed ranks. Profit appearing only at this depth and nowhere nearer usually means curve-fitting rather than a real pattern — a genuine speed edge almost always shows in the more recent figures too.
- Speed 4-Back Rank — positions each runner within its race on the speed figure four runs back, 1 = top rated. As the oldest of the single-run ranks it earns its keep as a consistency check: a horse ranked high on all four historic figures is a different proposition from one flattered by a single number. A bucket profitable here but nowhere in the fresher splits is the textbook over-fitting trap — leave it out.
- PRC Average Rank — sorts the race into rank order on PRC average — PRC being the Proform Race Class rating family — with 1 = top rated, every rank shown individually, and the usual
No ratinggroup. It orders the field by who has been performing at the highest class level, so expect strike rate to fall away from1stdownwards; a smooth decline with a profitable top group supports a class-based rule. A jagged, non-monotonic pattern means class rank is not what drives your results. - PRC Last Run Rank — uses last-run PRC — the class rating from each horse's most recent start — ranked within the race, 1 = top rated. It shines at flagging class-droppers: a horse top-ranked here met better company last time than today's rivals did. Set it against the PRC Average rank split; profit showing only on the last-run version points to a class-move angle, better captured as an explicit rule than left implicit in the system.
- PRC 2nd Last Rank — goes one run deeper, ranking each field on 2nd-last-run PRC with 1 = top rated. It shows how quickly your class signal decays: a healthy edge here that vanishes on last-run PRC hints the horses met weaker or muddling company most recently. Where the edge exists only at this depth, and on modest samples, be honest that it is more likely noise than insight.
- PRC 3rd Last Rank — the deepest of the class-rank splits — rank in the race on 3rd-last-run PRC, 1 = top rated. Its main value is confirmation: a system genuinely built on class should show a broadly similar shape across the last-run, 2nd-last and 3rd-last ranks. Divergence this far back rarely justifies a rule of its own; if you find yourself filtering on 3rd-last class rank alone, you are almost certainly fitting to the backtest.
RaceMetrics Ratings
These split by the RaceMetrics Ratings — our own figures for horses and their connections, taken as they stood at the time of each race. Coverage starts in 2023, so these splits only cover races from then on.
- RaceMetrics Rating (Combined) — splits by the headline blended RaceMetrics Rating (horse plus connections), banded; coverage from 2023. Strike rate will naturally climb with the band — the question is whether A/E climbs too, because a flat A/E means the market already prices the rating and it adds nothing to your angle. Where a top band holds A/E above 1.0 on a solid sample, harden it into a rating or rank filter; and remember the 2023 floor keeps samples smaller than splits built on longer histories.
- RaceMetrics Horse Rating — splits by the horse's own RaceMetrics Rating, banded; coverage runs from 2023. Reading it against the combined split tells you whether the horse or the connections carry your edge — a system that pays across all horse bands but only in top combined bands is really a stable angle in disguise. Profit concentrated in modest horse bands often points to unexposed improvers the rating has not caught up with, which pairs naturally with a lightly-raced or last-time-out condition.
- RaceMetrics Trainer Rating — splits by the trainer's RaceMetrics Rating at the time of the race, banded; coverage starts in 2023. Because the rating is taken as it stood on the day, this split reflects yards in and out of form rather than career reputation. A clean cliff — profit above a band, losses below — argues for a trainer-rating floor on the system; but check the trainer breakdown first, as one prolific yard can carry an entire bucket on its own.
- RaceMetrics Jockey Rating — splits by the jockey's RaceMetrics Rating at the time of the race, banded; coverage from 2023. A top-band edge often signals that a strong booking is the real tell inside your angle, and is worth turning into a jockey-rating rule. Profit from the lower bands is more fragile — unfashionable riders land big prices in streaks — so insist on a healthy A/E across plenty of runs, and beware one hot spell inflating a single bucket.
- Future Form Score — splits by how well the runner's recent races have worked out since — a 0–100 collateral-form score, banded; coverage begins in 2023. High bands mean rivals from those races have franked the form; if they also clear 1.0 on A/E, the market is slow to reprice that franking and a score floor is worth testing. An edge in the low bands suggests your angle profits from form that reads worse than it is — plausible, but confirm it survives the holdout split before leaning on it.
- RaceMetrics Sire Rating — splits by the sire’s RaceMetrics Rating at the time of the race, banded; coverage from 2023. The rank split beside it answers “best sire in this race”; this one answers “sires of this calibre, anywhere” — a different question, and the one you want when the angle is about a class of stallion rather than beating today’s rivals.
- RaceMetrics Damsire Rating — the same split for the damsire. Most useful where the damsire is doing the work the sire gets the credit for, typically on ground or trip changes.
- RaceMetrics Dam Rating — the same split for the dam. Expect a tighter spread than sire or damsire: most dams sit in the middle band, so read it for the tails rather than the shape.
- RaceMetrics Owner Rating — the same split for the owner. Reads as a proxy for the money behind a horse rather than its ability, so it tells you most in maidens and novice events.
- Collateral Score — splits by the strength of the runner’s collateral form lines, banded. The score is signed: positive means the rivals this horse beat went on to run well, negative means they ran badly, so the bands straddle zero. About 81% of runners carry a score — the rest have no shared-opponent connections to score from and land in “No collateral score”. Strike rate climbs steeply across the bands — 4.0% in the lowest, 14.3% near the top on flat and all-weather since 2023 — but the A/E stays between 0.98 and 1.02 throughout, so the market is already pricing it. Read it as a description of form quality, not as an edge on its own.
- Horse Rating (RM) Rank — splits by where the horse's RaceMetrics rating placed it in the field: 1st (top rated) down through every individual rank, with runners lacking a rating in an Unknown group; coverage from 2023. The rank asks a sharper question than the value bands above — not "how good is this horse?" but "was it the best in this race?" — and it self-adjusts to the strength of each field. If A/E peaks at rank 1, "+ rule" hardens it into a rank filter; an edge in ranks 2-4 often means the market over-bets the top-rated runner and leaves the value just below it.
- Trainer Rating (RM) Rank — splits by the trainer's rating rank within the race (1st = the strongest yard represented that day, every rank its own row); from 2023. Because the rating is point-in-time, the rank reflects which stable was in the best form then, not career reputation. Profit concentrated in the top ranks is a stable-strength angle in disguise — worth testing as an explicit rank rule — but cross-check the trainer breakdown first, since one prolific yard can dominate a rank bucket on its own.
- Jockey Rating (RM) Rank — splits by the rider's rating rank in the race (1st = the strongest booking on the day); from 2023. Bookings are information: profit clustered at the top ranks often means your angle is really detecting stable intent through the quality of the rider engaged. If the middle ranks pay better, the market may simply be over-charging for the fashionable names — a pattern worth confirming on a decent sample before promoting it to a rule.
- Sire Rating (RM) Rank — splits by the sire's rating rank within the race (1st = the best-rated father in the field); from 2023. Breeding ranks earn their keep where form is thin — debutants, second-time-outers and unexposed types — so read this split with your system's experience profile in mind. A top-rank edge in maiden or novice company suggests pedigree is doing real predictive work, and pairs naturally with a career-runs cap.
- Dam Rating (RM) Rank — splits by the dam's rating rank in the race (1st = the best-rated mother); from 2023. Dam quality is subtler than sire quality — fewer runners per dam means the market prices it less efficiently, so a persistent top-rank edge here can survive longer than a sire-based one. As with all breeding splits, it matters most for lightly-raced horses; on exposed handicappers the form has long since overtaken the pedigree.
- Damsire Rating (RM) Rank — splits by the damsire's rating rank in the race (1st = the best-rated maternal grandsire); from 2023. Damsires are the traditional clue for stamina and surface leanings that skip a generation, so this split is most telling where your system deals in first attempts at a new trip or ground. Treat a paying rank as a prompt to investigate why — a damsire angle with a breeding story behind it is worth far more than a bare number.
- Owner Rating (RM) Rank — splits by the owner's rating rank in the race (1st = the most powerful ownership represented); from 2023. Strong owners buy better horses and use better trainers, so much of this signal overlaps the trainer and horse ranks — the interesting case is where the owner rank pays and those don't, hinting at well-sourced horses in smaller yards. Thin ownership samples make the deeper ranks noisy; lean on the top few.
- Combined Score (RM) Rank — splits by the rank of the blended RaceMetrics connection score (1st = the best overall package of horse and connections in the race); from 2023. This is the headline rank shown on racecards, so it is also the most exposed to the market — strike rate will be high at rank 1, but only an A/E above 1.0 says it is underpriced. An edge that holds at ranks 2-3 while rank 1 loses is the classic "market over-bets the obvious one" shape, and a strong candidate for a rank 2-3 rule.
- Future Form Score Rank — splits by the runner's rank on the Future Form score (1st = the horse whose recent form has worked out best); from 2023. Ranking the score within the race finds the runner with the most strongly franked form relative to today's rivals, which matters more than the absolute score in weak races. If the top ranks clear 1.0 on A/E, the market is slow to reprice collateral franking — one of the quieter edges available — and worth writing in as a rank filter.
- Collateral Score Rank — splits by the runner's rank on the Collateral score, the shared-rivals form measure (1st = the strongest collateral case in the race); from 2023. Collateral lines are exactly the kind of cross-race arithmetic casual punters don't do, so a paying top rank here means your system profits from homework the market skipped. The deeper ranks say little — most value, if any, lives in the first two or three — so judge the split on those buckets.
- AI Rating Rank — splits by the runner's rank on the AI racecard rating (1st = the AI's top pick in the race); from 2023, and with the same caveat as the AI Rating filter: historical coverage is thin (roughly 8% of past runs), so buckets are small and the Unknown group large. Treat any pattern as a hypothesis rather than a finding — useful colour on a system you already trust, not a foundation to build one on.
Connections
These split by the people behind the horse — find the trainers, jockeys and owners your system keeps landing on.
- Trainer — splits by the horse's trainer. The fastest way to discover your angle is really riding on a handful of yards: sort by profit and see how much of the total the top two or three trainers contribute. If they carry it all, either promote them to a trainer filter and treat it as a stable-following system, or strip them out mentally and check the remainder still stands — otherwise the wider rules are just decoration.
- Trainer Nation — splits by where the yard is based: Ireland (whole island), Great Britain or overseas raider, worked out each year from where the yard's runners race. Put it against Course Nation in the Grid and you have the raiders table in one click — how Irish-trained runners fare at British tracks, by class or by meeting. A row reading "Unknown" is a yard with too few runs to place; it cannot be added as a rule, because there is no rule for "we could not tell".
- Jockey — splits by the rider. Profit concentrated in one or two jockeys is often a trainer angle wearing different colours — a stable's number-one rider inherits the yard's form — so read this alongside the Trainer split before crediting the booking itself. A spread of profitable riders is healthier evidence the edge lives in the horses and race conditions; a single hot name on thin runs is the classic over-fit trap.
- Owner — splits by the owner. Large operations with strings across several yards can genuinely drive a system — their horses are campaigned with a plan — but most owner buckets are tiny, so treat a profitable name on a dozen runs as a fluke until it repeats. Where a big owner does keep paying on real volume, cross-check the Owner / Trainer combo to see whether it is the owner or one particular yard doing the work.
- Trainer SR % (28d) — splits by the trainer's win strike-rate over the 28 days before the race, banded — a hot-or-cold-yard angle. If returns climb steadily through the bands, yard form is doing real work and a trainer-form filter is a natural refinement. Just as interesting is the opposite: a system that still profits from cold yards is finding horses the market has over-punished for stable form, which is a more durable edge than chasing the hot bands everyone can see.
- Jockey SR % (28d) — splits by the jockey's win strike-rate over the 28 days before the race, banded. Riders in form attract better mounts, so a hot band often just mirrors the stables currently booking them — compare with the trainer strike-rate bands before treating rider form as an independent signal. If profit holds up in the out-of-form bands, the market is discounting cold jockeys more than results justify, and that is where the price lives.
- Trainer / Jockey Combo — splits by trainer and jockey together — which partnerships drive the results. Combos fragment the sample fast, so demand real volume before reading anything into a profitable pairing. The interesting comparison is against the trainer's overall record: a stable whose runners only pay when a particular rider is up suggests the booking itself carries intent, and backing the yard only with that rider aboard can be a sharper rule than following the trainer blind.
- Owner / Jockey Combo — splits by owner and jockey together. The signal here is the retained rider: big owners put their number one up when a horse is fancied, and a pairing that outperforms the owner's overall record hints the booking is informative. But two-way combos slice the data thin — a profitable cell on a handful of runs is exactly the sort of coincidence back-tests manufacture, so insist on volume and a plausible story before acting.
- Owner / Trainer Combo — splits by owner and trainer together. For owners with horses in several yards this shows which stable placement actually pays — useful when an operation's overall figures hide one productive relationship. If a single pairing dominates, check the Trainer split before celebrating: the yard alone may explain it, and the owner adds nothing. As with all two-way combos, buckets shrink quickly, so a strong pairing needs a decent run count before it deserves its own filter.
Last Time Out
These split by what the horse did on its previous run. Form angles such as "placed last time out" or "dropping in class" live here; the next group repeats the same splits for two and three runs back.
- LTO Position — splits by the horse's finishing position last time out (1 = won last time). LTO winners are the market's darlings, so check whether their high strike rate is bought at poor A/E — many systems earn their profit from placed or narrowly beaten runners instead. If the edge sits in the mid positions, pair this with LTO Beaten Distance to separate close efforts from well-held ones before hardening it into a position filter.
- LTO Class — splits by the class of its last race, so you can see the effect of stepping up or dropping down in grade. Read it alongside Class Move vs LTO: profit concentrated among horses last seen in a higher grade points to a class-dropper angle, while an edge from lower-grade last runs suggests you are catching improvers on the way up. A single strong class bucket on a thin sample is more likely over-fitting than insight.
- LTO Distance — splits by the trip of its last race — handy for studying distance changes. Set it against today's distance: an edge concentrated where the last run came over a shorter trip often marks horses stepping up after finishing their races strongly, a well-known improvement angle. Profit isolated to one narrow trip band should be treated as noise until the run count says otherwise — distance buckets thin out fast once a system carries other conditions.
- LTO Going — splits by the ground it last ran on. Ground switches are where the market misreads form: it is slow to excuse a poor run on unsuitable going, so if your system profits from horses last seen on ground unlike today's, it may be quietly exploiting exactly those defeats. Cross-check with LTO Beaten Distance — well-beaten last runs on extreme going are the ones most likely to be misleading the market.
- LTO Field Size — splits by how big its last field was. Form from big, competitive fields tends to be underrated — a midfield finish in a large handicap is a better effort than the bare position suggests — so an edge in the bigger bands often means your system is catching hidden form. Small-field last runs cut the other way: positions flatter, and a weak bucket there is a nudge towards a minimum last-time field-size rule.
- LTO Fav Status — splits by its market rank last time (favourite, second favourite, or unfancied). The classic play here is the beaten favourite: a horse sent off market leader last time and turned over often remains well treated, so cross this split with LTO Position to isolate that group. If the profit comes instead from horses unfancied last time, the system is finding improvement the market missed — a more fragile edge, so demand a bigger sample before trusting it.
- LTO SP Rank — splits by the horse's exact market rank (by SP) last time out: 1st (favourite) that day, then 2nd, 3rd and so on, with debutants in an Unknown group. It is the numeric version of LTO Fav Status, for when favourite/second-favourite labels are too coarse — say, separating horses that were 4th in the betting from rank outsiders. Cross it with LTO Position: well fancied last time yet beaten is the classic beaten-favourite profile, while a win off a big LTO rank marks a horse the market has already misjudged once. Because it comes from the previous, completed run, it works for live qualifiers as well as back-tests.
- LTO Power Rating Rank — splits by where the Power Rating put the horse in last time's field: 1st (top rated) that day, then every rank its own row, with an Unknown group for debutants and unrated runs. Cross it with LTO Position to separate horses that ran to their rating last time from those that did not.
- LTO Weight Rank — splits by where the horse stood in the weights last time out (1st = top weight that day, every rank its own row, Unknown for debutants). In handicaps the weight rank is a proxy for how the handicapper rated it against that field — a top weight that ran well was conceding weight all round, form that reads better than the bare position. Profit from the low weight ranks can flag leniently-treated improvers still ahead of the assessor; like the SP version, it is known before today's race, so it can drive qualifiers.
- Class Move vs LTO — splits by today's class number minus last time out's: positive means it has dropped in class (an easier race), negative means it has stepped up. Class droppers win more often but the market knows it, so judge these buckets on A/E and ROI rather than raw strike rate. A step-up bucket that still pays is often the more genuine edge — improving horses beating the handicapper — and worth promoting to a class-move filter.
- Distance Move vs LTO — splits by today's trip minus last time out's, in real furlongs (exact yards, not rounded categories). "Same trip" means within half a furlong of today's distance; the other buckets grade the step up or down in trip. Its + rule button adds the matching Distance Change filter, so a bucket becomes a rule with the same definition. Horses proven at today's trip and horses deliberately stepped up in distance behave very differently — this split shows which one your system is actually catching.
- LTO Speed vs Class Par — splits by the last-time-out speed figure minus the class par of that race — did the horse run faster or slower than a typical winner of the grade it contested? The buckets run from "16+ below par" up to "15+ above par", and win rate climbs steadily through them (roughly 6% at the bottom to over 20% at the top), so this is a strong single split. As ever, the market largely knows it: judge the above-par buckets on A/E and ROI before promoting one to a filter with the + rule button, and read the "around par" bucket alongside Class Move vs LTO — an on-par figure in a higher grade than today's is better news than the same figure in a weaker race. Horses with no last-run figure show as "Debut / no figure" and can't be drilled into.
- LTO Days Off — splits by the layoff the horse had going into its last run — the break before the LTO, not before today's race. The angle to hunt is the second run after an absence: horses that returned from a long break last time often needed it, so a modest LTO position can be forgiven while the market is slower to do so. A profitable long-layoff bucket pairs naturally with a days-since-last-run condition on today's race.
- LTO Run Style — splits by its run style (pace abbreviation) last time out: led, prominent or held up. Run style is persistent, and horses that led last time win more often than the market allows, so a front-running bucket holding its A/E above 1.0 is one of racing's better-documented angles and a natural candidate for a run-style rule. If the profit sits with hold-up runners instead, check whether your system's races tend to be strongly run — closers need a pace to aim at.
- LTO Headgear — splits by the headgear worn last time out (first matching aid). Compare it with today's headgear: a horse that wore blinkers or cheekpieces last time and sheds them today, or vice versa, is a different proposition from one with a settled arrangement. First-time headgear often sparks a single improved run, so where last time's aid was newly fitted, treat that form line with scepticism before letting it drive a filter.
- LTO Beaten Distance — splits by how many lengths it finished behind the winner last time out; winners and non-finishers form their own groups. Narrowly beaten horses carry obvious form and are priced for it, so it is often the mid-range beaten distances — competitive but easily dismissed — where A/E holds up best. A profitable non-finisher group deserves scrutiny: over jumps especially, the market can over-punish a faller whose race was going well.
- LTO ISP — splits by its starting price last time out, banded. Last time's SP is a record of how the market rated the horse then: profit in the shorter bands means you are re-backing horses the market once fancied, often after a forgivable defeat, while profit in the bigger bands means the system spots improvement before the market does. The latter tends to rest on a few big-priced winners, so check how many wins sit behind any such bucket before relying on it.
- LTO Price Ratio SP — last time out’s decimal SP divided by that race’s field size, banded. The plain SP bands can mislead across field sizes (6/1 in a 6-runner race was far less fancied than 6/1 in a 20-runner cavalry charge); the ratio normalises that, so profit in the low bands means re-backing horses the market genuinely fancied last time whatever the field size. Drill a band and the "+ rule" writes the matching LTO Price Ratio SP filter.
- LTO Price Ratio BSP — the exchange version: last time’s decimal Betfair SP over the field size, banded. Betfair books sum to roughly 100% whatever the field size, so this is the purest field-size-consistent read of how the market rated the horse then. Both ratios also exist for two and three runs back on the 2 & 3 Runs Back tab.
- LTO Classification — splits by what KIND of race the horse contested last time: maiden, novice, seller, claimer, nursery, Group/Listed and so on. Race trends often hinge on this — handicap debutants out of maidens behave very differently from horses dropping out of Listed company. A race can carry several classifications at once (a novice handicap hurdle is a novice AND a handicap AND a hurdle), so one bet can legitimately appear on more than one line — read each line as "the last race was tagged X", and expect the line totals to add up to more than the headline bet count. Clicking + rule on a line adds the matching LTO Classification filter.
- LTO Course — splits by where the horse ran last time out. Some tracks' form works out better than others — a run at a major, competitive fixture is usually a stronger reference than one from a minor venue — so look for whether the profitable buckets share a type of course rather than being scattered at random. With dozens of possible courses each bucket can be tiny; one paying track on a handful of runs is the textbook over-fit, not an angle.
- LTO Draw — splits by the stall it was drawn in last time out (flat races only). Its main use is excuse-hunting: a horse posted wide from its stall at a draw-sensitive track can run far better than the result shows, so a profitable bucket at either extreme of the draw suggests the system forgives runs the market took at face value. Pair it with LTO Position or LTO Beaten Distance to confirm the poor runs really trace back to the stall.
2 & 3 Runs Back
The Last Time Out splits, pushed back one and two more runs — so you can study the shape of a horse's last three outings.
- 2-Back Position — splits by where it finished two runs ago. Read it against the last-run position split to see the shape of the form cycle your system catches: strong last-time finishes off poor 2-back ones mean you are backing improvers, while the reverse pattern means the angle thrives on horses the market has just cooled on. Horses with fewer than two career runs simply drop out of this table rather than forming a bucket.
- 2-Back Class — splits by the class of the race two runs back. Together with the last-run class split it maps the class trajectory: higher class two back and lower since is the drop-through-the-grades profile, where beaten form in better company masks real ability. If the higher-class buckets outperform here, consider hardening that into an explicit class-move filter rather than leaving it implicit in a breakdown.
- 2-Back Distance — splits by the trip the horse ran over two runs back. Trip patterns across the last three runs reveal experiments — stepped up two back, dropped back since, or vice versa — and whether your qualifiers arrive with proven form at something like today's distance. If buckets far removed from your system's typical race trip perform best, that hints you are catching horses returning to a distance that suits after a stint at the wrong trip.
- 2-Back Going — splits by the ground the horse encountered two runs back. Unsuitable going is an excuse the market forgets quickly, so an outperforming heavy or firm bucket can mean your system collects horses whose 2-back defeat was ground-induced rather than a loss of form. Read it with the 2-back beaten-distance split — well beaten on extreme ground, then returned to a suitable surface, is form worth forgiving.
- 2-Back Field Size — splits by the size of the field two runs back. Field size changes what a finishing position means: mid-division in a big-field handicap is a far better effort than the bare figure suggests, while a placing in a tiny field can flatter. If the larger-field buckets outperform, your system is profiting from form the market reads too literally; the 2-back position split will confirm whether that pattern holds.
- 2-Back Fav Status — splits by its market rank two runs back — whether it was favourite, close to the head of the market or unfancied. Strong figures in the fancied buckets suggest the angle recovers horses the market believed in two starts ago and has since lost faith in, a profile punters have long tracked through beaten-favourite lists. Viewed next to the last-run favouritism split, fancied two back but unfancied since is the drift most worth investigating.
- 2nd-LTO SP Rank — splits by its exact market rank (by SP) two runs back: 1st (favourite) that day, then every rank individually, with an Unknown group where no second-last run exists. The numeric companion to 2-Back Fav Status — read it alongside LTO SP Rank to trace the market's faith across the cycle, where a short rank two back followed by a bigger one last time is the once-fancied horse the crowd has cooled on. Known from a completed past run, so it can drive live qualifiers as well as back-tests.
- 2nd-LTO Weight Rank — splits by its weight rank two runs back (1st = top weight that day, every rank its own row, Unknown where the run doesn't exist). Set against LTO Weight Rank it shows the handicapper's response across the last two starts — a horse sliding down the weights has been getting beaten, and one your system still profits from may be being over-punished for excusable defeats. Most meaningful when your system lives in handicaps, where the weight rank tracks the official assessment directly.
- 2-Back Days Off — splits by the days off the horse had going into its run two back. The pattern worth hunting is the run-after-a-break sequence: a long-layoff bucket here means today is likely the horse's third start since a break, a point at which many trainers have runners primed. If that bucket outperforms, pair it with a current days-since-last-run filter so both layoffs frame the comeback precisely.
- 2-Back Run Style — splits by how it ran two runs back: led, prominent or held up. Its value lies in confirming whether a run style is habitual — a horse that led both last time and two back is a dependable front-runner, whereas a single leading run may just reflect how one race unfolded. If your system leans on run style, matching buckets here and in the last-run pace split put that assumption on much firmer ground.
- 2-Back Headgear — splits by the headgear worn two runs back (the first matching aid). Compared against the last-run headgear split it exposes equipment changes: nothing here but an aid last time marks a recent first-time fitting, while headgear here and none since means the aid was tried and discarded. Both patterns speak to a stable's intent, and either is worth testing as a rule in its own right.
- 2-Back Beaten Distance — splits by lengths behind the winner two runs back, with winners and non-finishers each forming their own group. Set beside the last-run beaten-distance split it shows whether the angle catches steady types or sharp improvers — well beaten two back but close last time is exactly the profile the market underprices. Keep an eye on the
DNFgroup too: a fall or pull-up two runs ago can leave a genuinely able horse at a forgiving price. - 2-Back ISP — splits by its starting price two runs back, banded. Price two runs ago is a snapshot of how the market rated the horse before its recent form existed, so comparing it with the last-run ISP split shows the market's faith rising or fading across the cycle — short two back but bigger since often flags a well-regarded horse being marked down for a single poor run. The outer bands tend to be thin, so demand a healthy run count before trusting them.
- 2-Back Course — splits by where it ran two runs back. Course tables scatter across a long list of tracks, so over-fitting is the danger here — a single venue showing a profit on a handful of qualifiers is almost never a real edge. It earns its keep when a pattern has a story behind it, such as horses stepping out of strong-form fixtures or a trainer who habitually preps runners at one venue before striking elsewhere.
- 2-Back Draw — splits by the stall drawn two runs back (flat races). A bad draw is one of racing's great hidden excuses, so an outperforming bucket at the extremes can mean your system profits from horses whose 2-back run reads worse than it was. Cross-check against the 2-back beaten-distance split — poorly drawn and well beaten two starts ago, then eased in the market, is a classic value profile.
- 3-Back Position — splits by where it finished three runs ago. This is the third point on the form curve — line it up with the last-run and 2-back position splits to confirm a genuine trend, such as steadily improving finishes across the last three starts. On its own a run three back carries the least signal in the family, so a profitable bucket here with no echo in the nearer splits is usually noise; horses with fewer than three career runs drop out.
- Distance Move vs 2-Back / Distance Move vs 3-Back — splits by today's trip minus the trip the horse ran 2 (or 3) runs back, in real furlongs. "Same trip" = within half a furlong of today's distance. The powerful combination is the Grid: put 2-Back Position down the side and Distance Move vs 2-Back across the top and every cell is that pairing's P&L — "placed 2 back at today's distance" sits in one cell, with the shorter- and longer-trip versions alongside for comparison. Each bucket's + rule button adds the matching Distance Change filter, and those filters are known pre-race, so the angles work for today's qualifiers.
- 3-Back Class — splits by the class of the race three runs back. Set it next to the LTO class split to see the grade trajectory across a horse's last three starts — a bucket that faced stronger company three back often flags well-handicapped droppers, while horses climbing through the grades tell the opposite story. A profitable high-class bucket on a solid run count is worth writing into a rule; note that lightly raced horses drop out of this split rather than forming their own bucket.
- 3-Back Distance — splits by the trip three runs back. Alongside the LTO distance split it exposes trip experiments across the form cycle — a horse that ran shorter three starts ago and has stepped up since, or one being shuffled between distances by a trainer still searching. Horses kept to a consistent trip over their last three runs tend to have more reliable form figures; if profit clusters where the 3-back trip differs sharply from today's, that distance switch is worth testing directly.
- 3-Back Going — splits by the ground three runs back. Ground is the classic hidden excuse: a poor effort on unsuitable going three starts ago can still depress a horse's price two runs later, so a profitable bucket at one extreme may mean your system is quietly collecting excusable runs the market never forgave. Cross-check against the LTO going split — if the same extreme pays in both, today's ground conditions deserve a rule of their own.
- 3-Back Field Size — splits by the size of the field three runs back. Field size governs how much a form figure means: a big-field run three starts ago is a sterner, more informative test, while small-field form can flatter or conceal ability. Winners drawn disproportionately from horses tested in large fields earlier in the cycle suggest the form your system leans on is robust; if profit sits in the small-field buckets, check the same horses' larger-field efforts before trusting it.
- 3-Back Fav Status — splits by its market rank three runs back. Market confidence that far back is easily forgotten: a horse sent off favourite three starts ago but beaten since can still harbour the ability that made it fancied, at a price the current market no longer reflects. Trace how the market's faith has shifted by pairing this with the LTO favourite split — a system profiting on 3-back favourites the market has since abandoned is finding horses the crowd gave up on too soon.
- 3rd-LTO SP Rank — splits by its exact market rank (by SP) three runs back (1st = favourite that day; Unknown where no third-last run exists). It completes the market-rank trajectory across the last three starts: read with the LTO and 2nd-LTO SP Rank splits, a steadily drifting rank is a horse the market is giving up on, while a steadily shortening one is being found out as an improver. On its own the three-back rank carries the least signal of the family, so treat an isolated paying bucket here with suspicion.
- 3rd-LTO Weight Rank — splits by its weight rank three runs back (1st = top weight that day, every rank its own row, Unknown where the run doesn't exist). The earliest point on the weights trajectory — alongside the LTO and 2nd-LTO versions it shows whether a handicapper has been steadily easing a horse's position in the weights across its recent runs, the profile of a plot slowly coming to fruition. Like the other prior-run ranks it is known before today's race, so it is qualifier-legal.
- 3-Back Days Off — splits by the days off the horse had going into its run three back. Alongside the last-run and 2-back layoff splits it reconstructs the spacing of the whole recent campaign — a long-break bucket here puts today's race deep into a post-layoff sequence, while short gaps across all three point to a busy horse that may be near the end of its cycle. Horses without three career runs to their name simply drop out.
- 3-Back Run Style — splits by how it ran three runs back: led, prominent or held up. As the third reading of run style it settles whether tactics are truly ingrained — the same style across all three recent runs is as reliable a pace profile as you will find, valuable when a system depends on projected early position. A different style here from the last two can mark a tactical switch; check whether that switch coincided with the improvement your system catches.
- 3-Back Headgear — splits by the headgear worn three runs back (the first matching aid). Its real job is dating equipment changes: nothing here but headgear in the two nearer splits means the aid went on two starts ago — if it stays on today, this is the third run in it, about the point where any headgear effect has either stuck or worn off. Headgear present across all three runs is simply part of the horse's setup and tells you little on its own.
- 3-Back Beaten Distance — splits by lengths behind the winner three runs back, with winners (
Won) and non-finishers (DNF) grouped separately. As the earliest point on the beaten-distance trajectory, it confirms whether margins have been narrowing across the last three starts — the signature of a horse coming to the boil — or steadily widening in decline. A profitableWonbucket here often means the system catches horses three runs after a win, when a class rise and a defeat or two have pushed the price out. - 3-Back ISP — splits by its starting price three runs back, banded. This is the earliest market snapshot in the family: read across the 2-back and last-run ISP splits, it traces whether a horse has been steadily drifting — a once-fancied sort the market is giving up on — or shortening as it improves. Profit stranded in a single band here, unsupported by the nearer price splits, is a textbook over-fit; a coherent trend across all three is the real signal.
- 3-Back Course — splits by where it ran three runs back. With dozens of possible venues and the run three starts distant, this is the most fragmented split in the family — treat any single profitable course with a small run count as coincidence. Where it does add value is in confirming a venue chain seen in the last-run and 2-back course splits, such as a yard that routinely routes horses through the same track early in a campaign.
- 3-Back Draw — splits by the stall drawn three runs back (flat races). Its main use is excuse-hunting deep in the form cycle: a horse trapped wide three starts ago may have posted a poor figure the market still holds against it two runs later. Read it alongside the LTO and 2-back draw splits — if profit concentrates among horses carrying a wide-draw excuse in their recent form, that is a signal worth promoting to a rule rather than leaving to chance.
Breeding & Pedigree
These split by the horse's family tree and birth details — the domain of pedigree-led angles (first-time-out two-year-olds, ground-loving sire lines, and so on).
- Sire — splits by the horse's father. Sire angles are a cornerstone of pedigree betting, especially for unexposed types whose ability is still guesswork but whose pedigree is not. Look for sires holding A/E above 1.0 under your system's specific conditions, then cross-check the going and distance splits — a sire edge is usually a conditions edge in disguise. Beware rows inflated by one prolific multiple winner; the runs count alone will not reveal that.
- Dam — splits by the horse's mother. This is the most granular pedigree split of all — most dams contribute only a runner or two to any cohort — so treat it as a diagnostic rather than a source of filters. Its real value is exposing concentration: if a large slice of your system's profit traces back to the produce of one or two mares, the backtest is memorising a family, not finding a repeatable pattern.
- Damsire — splits by the maternal grandsire (the dam's father), often a strong pointer to stamina and ground preference. Because a damsire's influence flows through many daughters, samples can be respectable, and a bucket that stays profitable across dozens of runs under soft-ground or staying conditions supports adding a matching going or distance rule. Read it alongside the Sire split: where both point the same way, you are likely looking at a genuine pedigree pattern rather than one family flattering the figures.
- Sire Country — splits by the country the sire stands or originates in. National sire lines carry broad tendencies — American lines traditionally lean towards speed and fast surfaces, French and German lines towards stamina and cut in the ground — so a strong country bucket often echoes your system's going or distance profile. Treat it as confirmation and refine with the going split rather than filtering on country itself; the minor breeding nations will rarely offer a sample worth trusting.
- Sire Age — splits by the sire's age band, a rough proxy for how established or fashionable the stallion is. Younger bands sweep up first-season and unproven sires, where hype can leave stock over-bet and A/E depressed; older bands hold proven but thoroughly exposed lines the market may quietly underrate. Watch A/E rather than raw strike rate here, and hesitate before building a rule on one band — the sire population drifts through the bands every year, so yesterday's edge migrates.
- Country of Birth — splits by where the horse itself was foaled (GB, IRE, USA, etc.). Birthplace is frequently a proxy for something else — imported runners arrive through particular yards and get aimed at particular races — so before acting on a profitable overseas bucket, check which trainers and race types supply those runners. The home nations will dominate the runs; profit in an exotic bucket on a handful of runners is a curiosity, not a filter.
- Foaling Month — splits by the month the horse was born. Early foals can have a physical maturity edge over late ones, especially in juvenile racing, where a few months of growth matter most. If your system touches two-year-olds, check whether strike rate decays through the later months — a genuine maturity effect should fade as the cohort ages, so the same pattern persisting in all-aged handicaps is more likely noise than signal.
Horse Record
These split by the shape of the horse's recent record — its freshness and momentum.
- Runs Since Win — splits by how many runs in a row the horse has gone without winning (0 = won last time out), banded. Strike rate naturally decays as the losing run stretches, so read the A/E column rather than raw win percentage: the market over-bets recent winners and neglects horses several runs past their last success. A system that stays profitable in the longer bands is often finding well-handicapped types sliding down the weights — worth pairing with an official-rating or class-drop filter to sharpen the angle.
- Runs Last 90 Days — splits by how busy the horse has been — its number of runs in the 90 days before the race, counted point-in-time. This is the fitness-versus-freshness read: a strike-rate cliff at zero recent runs means the angle wants a recent outing, while an edge in the busiest bands suggests you are catching in-form campaigners being turned out quickly. Whichever bucket pays, cross-check it against days since last run — the two overlap heavily, and tightening both is a classic over-fitting trap.
Sectionals
These breakdowns are built from sectional timing data — fine-grained, in-race speed measurements — and require the optional Sectionals data subscription to appear and populate. The underlying data starts in 2023, so these splits only cover races from then on.
- Gate Speed — (Sectionals add-on) — splits by how quickly the horse breaks from the stalls, measured as an average gate-speed percentile from its prior runs (point-in-time), separating fast-starting front-runner types from slow-away horses. Sectional data, from 2023. A slow break costs most over sprint trips and in big fields, so weigh the split against distance and field size: a strike-rate cliff in the slow-away buckets there carries far more signal than the same gap in staying races, where early position matters less.
- Distance DNA — (Sectionals add-on) — splits horses by what their sectional cadence says about their ideal trip versus winners at the distance: wants further, right trip, or wants shorter (needs at least 3 prior sectional runs to classify). Profit concentrated in the right-trip bucket is the intuitive read; returns from the wants-further or wants-shorter groups suggest the market underrates horses racing outside their ideal range. The 3-run requirement thins every bucket, so treat a profitable band built on a handful of qualifiers as unproven.
- LTO Max Upgrade Rank — (Sectionals add-on) — splits by the in-race Max Upgrade (last 4f) rank the horse held last time out, one bucket per rank. The headline finding is counter-intuitive: 1st on upgrade often performs WORSE next start than 2nd-4th — judge the buckets on A/E before promoting one with + rule. Runs without sectional coverage fold into a No-sectional-data bucket.
- LTO Finishing Speed % Rank — (Sectionals add-on) — splits by the in-race finishing-speed rank from the last run (1st = fastest finisher that day). Use it to find where the "ran on well" signal actually pays: the top ranks win more next time, but the market knows — the value often hides in ranks 2-3 rather than 1. Drill any rank into a rule with + rule.
- LTO Finish Upgrade Rank — (Sectionals add-on) — splits by the in-race Finish-section upgrade rank the horse held last time out (1st = the biggest upgrade earned in the Finish section itself that day, a tighter late-momentum signal than the last-4f Max Upgrade). Drill any rank into a rule with + rule. Runs without sectional coverage fold into a No-sectional-data bucket.
- Positions Gained After Upgrade (avg) — (Sectionals add-on) — splits by the average number of places the horse would have gained (+) or lost (−) over its prior sectional runs by running each race efficiently: its finishing position minus its position once every runner's sectional upgrade is applied. It is not a running style: a high bucket holds horses whose runs have kept being better than their finishing positions, and whether that pays next time is exactly what the split tests.
A breakdown splits your system one way at a time. The Grid splits it two ways at once: pick what goes down the side, pick what goes across the top, and every cell is the answer for that pair. Every trainer down the side and race class across the top; jockeys against courses; sires against distance; a sire against the exact number of runners (5, 6, 7… — the splits where place terms change). Anything against anything.
It comes from a question we get a lot, in one form or another: “What's each trainer's strike rate in August, over the last five seasons, split by class?” Before the Grid you could answer half of that at a time — one trainer across all the classes, or one class across all the trainers. Now it's one screen.
Season against season, week by week. Put Week Number down the rows and Year across the columns and the whole record lays out as a calendar — every Monday-to-Sunday week of the year against every season since 2018. That way round matters: 53 weeks fit comfortably down the rows, whereas as columns they would be cut off well short. Two settings are worth changing for this one: raise Show top above 53 so no week is left out, and click the Week Number heading once to put the rows in calendar order rather than biggest-sample-first. It is the table people used to build by exporting the runs to a spreadsheet.
- Rows and Columns — any two of the breakdown dimensions. Swap flips them round.
- Show — which number fills the cell: strike rate, A/E, ROI, P/L, PRB, IV, Chi, place strike rate, runs or wins. Changing it redraws instantly; it doesn't go back to the database.
- Min runs — lines with fewer runs than this are left out altogether, and individual cells below it are greyed rather than shown as a percentage. A 100% strike rate off one run is noise, and it should look like noise.
- Show top — how many lines to display, up to 150, biggest sample first.
Chi in the Grid. A grid is many tries at once, so when it shows a Chi, a note under it says how many cells luck alone would put at Chi 4 or more against how many are, and the Chi a cell needs once you allow for the number of cells (the Bonferroni correction). Cells that clear it are underlined. With 500 cells on screen that bar is over 15, which is why a scattering of 4s across a big grid proves very little.
The colour is relative to your system, not to some absolute. Blue means that cell is doing better than the system does overall; amber and red mean worse. For A/E and IV the comparison is an even 1.00, and for P/L and ROI it's breaking even.
Click any cell to see the runs behind it. Shift-click and it adds both rules to your system at once — the trainer and the class — so a cell that catches your eye becomes the next version of the system in one action. CSV downloads the grid exactly as shown.
Refining a system
Goal Seek answers "what single rule could I add to make this better?". Pick a target — A/E, ROI, strike rate or profit per run — click Find, and it scans your system's breakdowns for the one rule that would lift that target the most. Every suggestion is significance-checked (using a statistical test called chi-squared) so you're not chasing a fluke.
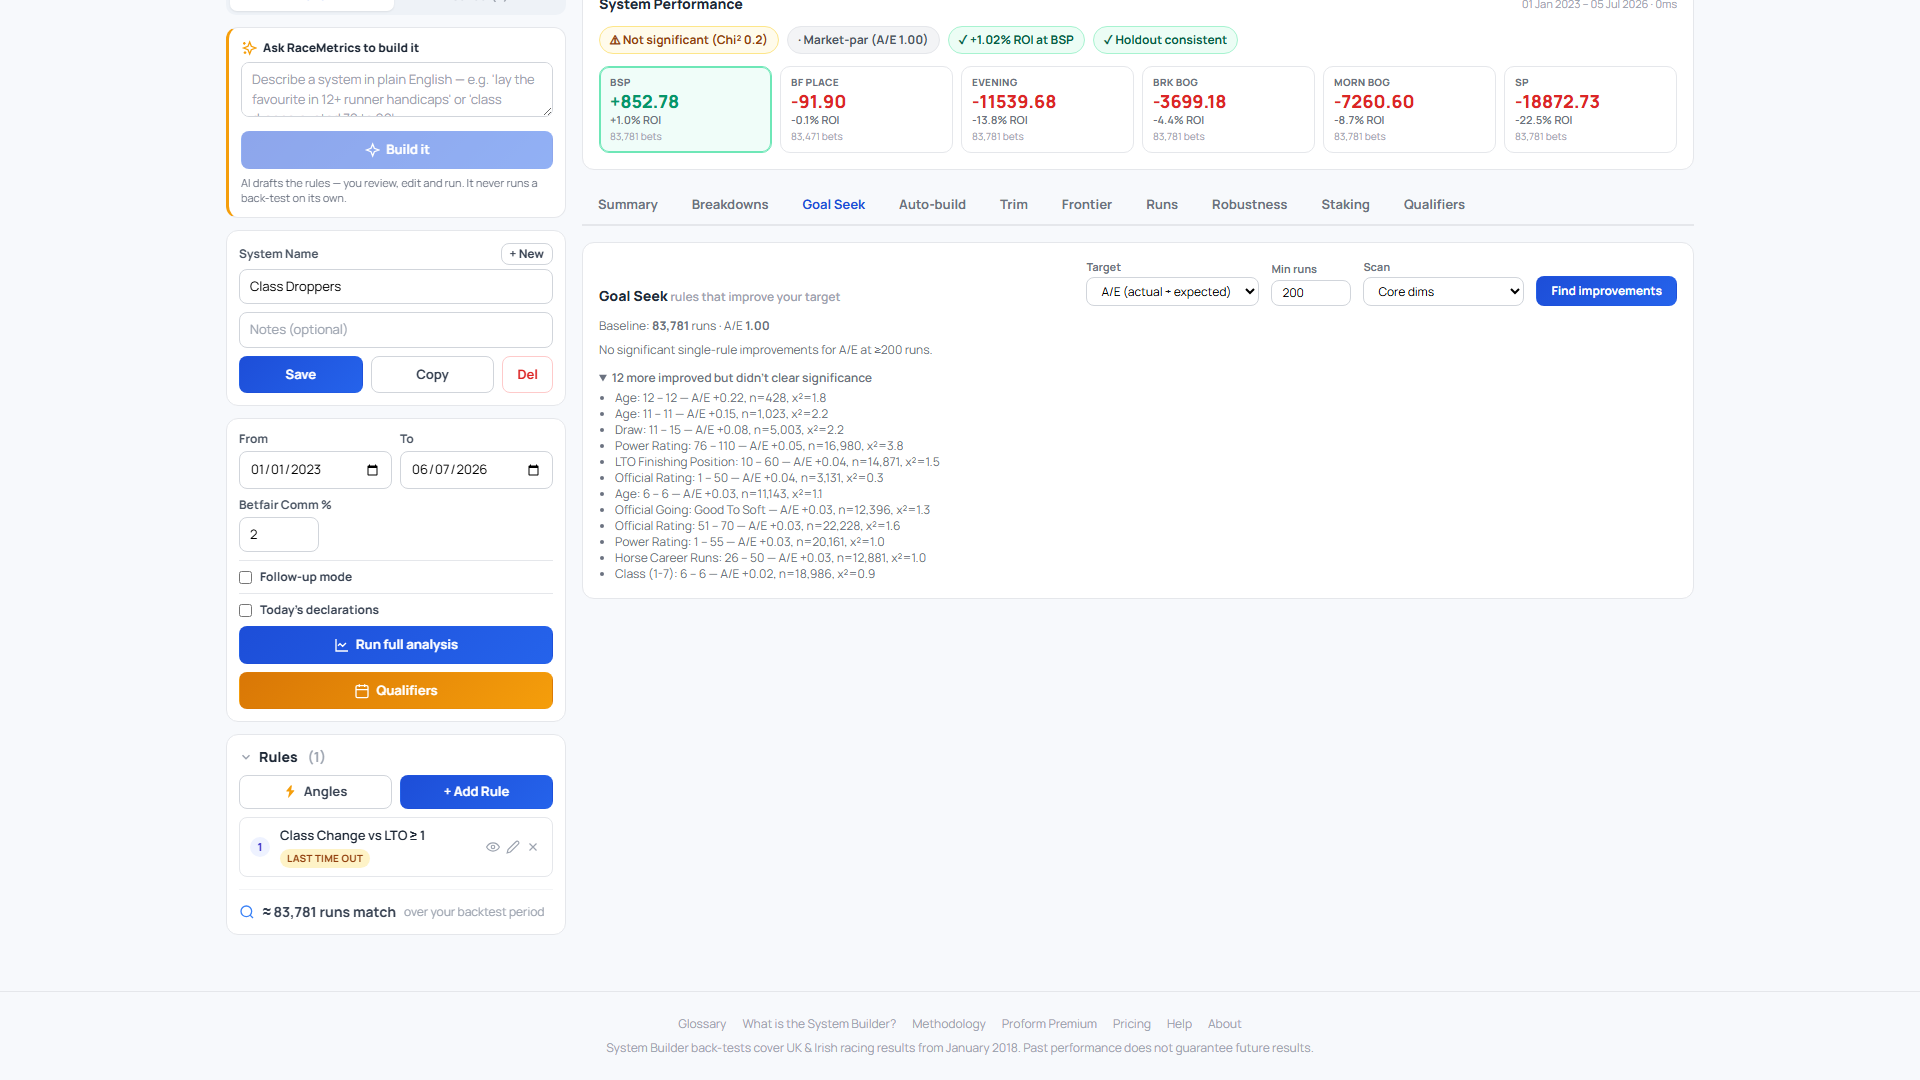
Hit Apply to add a suggested rule, then re-run to find the next improvement on the now-tighter system. Each suggestion offers a one-click robustness check against the last 12 months, so you can see whether the improvement is likely to last.
Auto-build is Goal Seek on autopilot. Tell it what you want to reach — for example "BSP ROI of at least 5%, keeping at least 500 runs" — and it builds a system toward that spec one rule at a time, running Goal Seek repeatedly and adding the best rule each round until it hits your target (or can't safely go further).
Holdout-guarded at every step
This is the one tool where over-fitting is a real danger: the more rules you pile on, the easier it is to accidentally fit noise instead of a real edge. So Auto-build checks every step against the future — it trains on the older data, tests on the last 12 months, and only keeps a rule if it holds up out-of-sample. The moment the best remaining rules only work in the training data, it stops and says so. "Stopped to avoid over-fitting" is a feature, not a failure — it means the tool refused to hand you a system that looks great on paper but wouldn't have worked going forward.
How to read it
Each step shows the rule it added, how it moved your target, and a small badge: ✓ holds up out-of-sample or ✗ over-fit. When it finishes — whether it reached your target or stopped early — click Load this system into the builder to review, tweak and run it like any other system. Nothing is applied until you load it.
Trim is the mirror image of Goal Seek. Instead of suggesting rules to add, it re-tests each rule you already have with that rule removed, and tells you which ones to cut. It's how you de-clutter an over-complicated system and let more qualifiers through without losing your edge.
The four verdicts
- Drop — the runners this rule excludes actually carry an edge; removing it improves your target. Cut it.
- Loosen — the rule barely moves your target either way; it's a volume lever you can relax for more bets.
- Keep — load-bearing; removing it genuinely weakens your target. Leave it alone (these collect in a separate list).
- Redundant — the rule excludes nothing your other rules don't already. Harmless to remove.
Click Remove on any card to cut that rule, then re-run to re-assess the looser system. As with Goal Seek, each suggestion has a robustness check.
Most systems have one number doing the heavy lifting — a rating rank of 3, odds under 8, a field of at most 12. The Frontier tab asks the obvious question: why that number? Pick the rule, give it a ladder of values, and it re-runs the whole back-test once per value, charting volume against BSP ROI as the rule tightens.
- The shape tells the story. A smooth curve means the edge degrades gently and your threshold is a preference; a cliff means one value is carrying the result — a classic over-fitting warning, worth a Robustness check.
- The rule-off point anchors the loose end: the same system with that rule removed entirely.
- Use on any row sets the rule to that value; re-run the full analysis to refresh the other tabs.
Sweeps run one back-test per value (up to 12), tightest first, and stop early if the cohort gets too large — narrow the dates if you hit that.
The biggest danger with any system is over-fitting — tuning it so tightly to the past that it stops working in future. The Robustness tab is your defence. It splits your history into a training period and a held-out last 12 months, tunes on the training part, and then checks whether the edge still shows up in the recent slice it never saw.
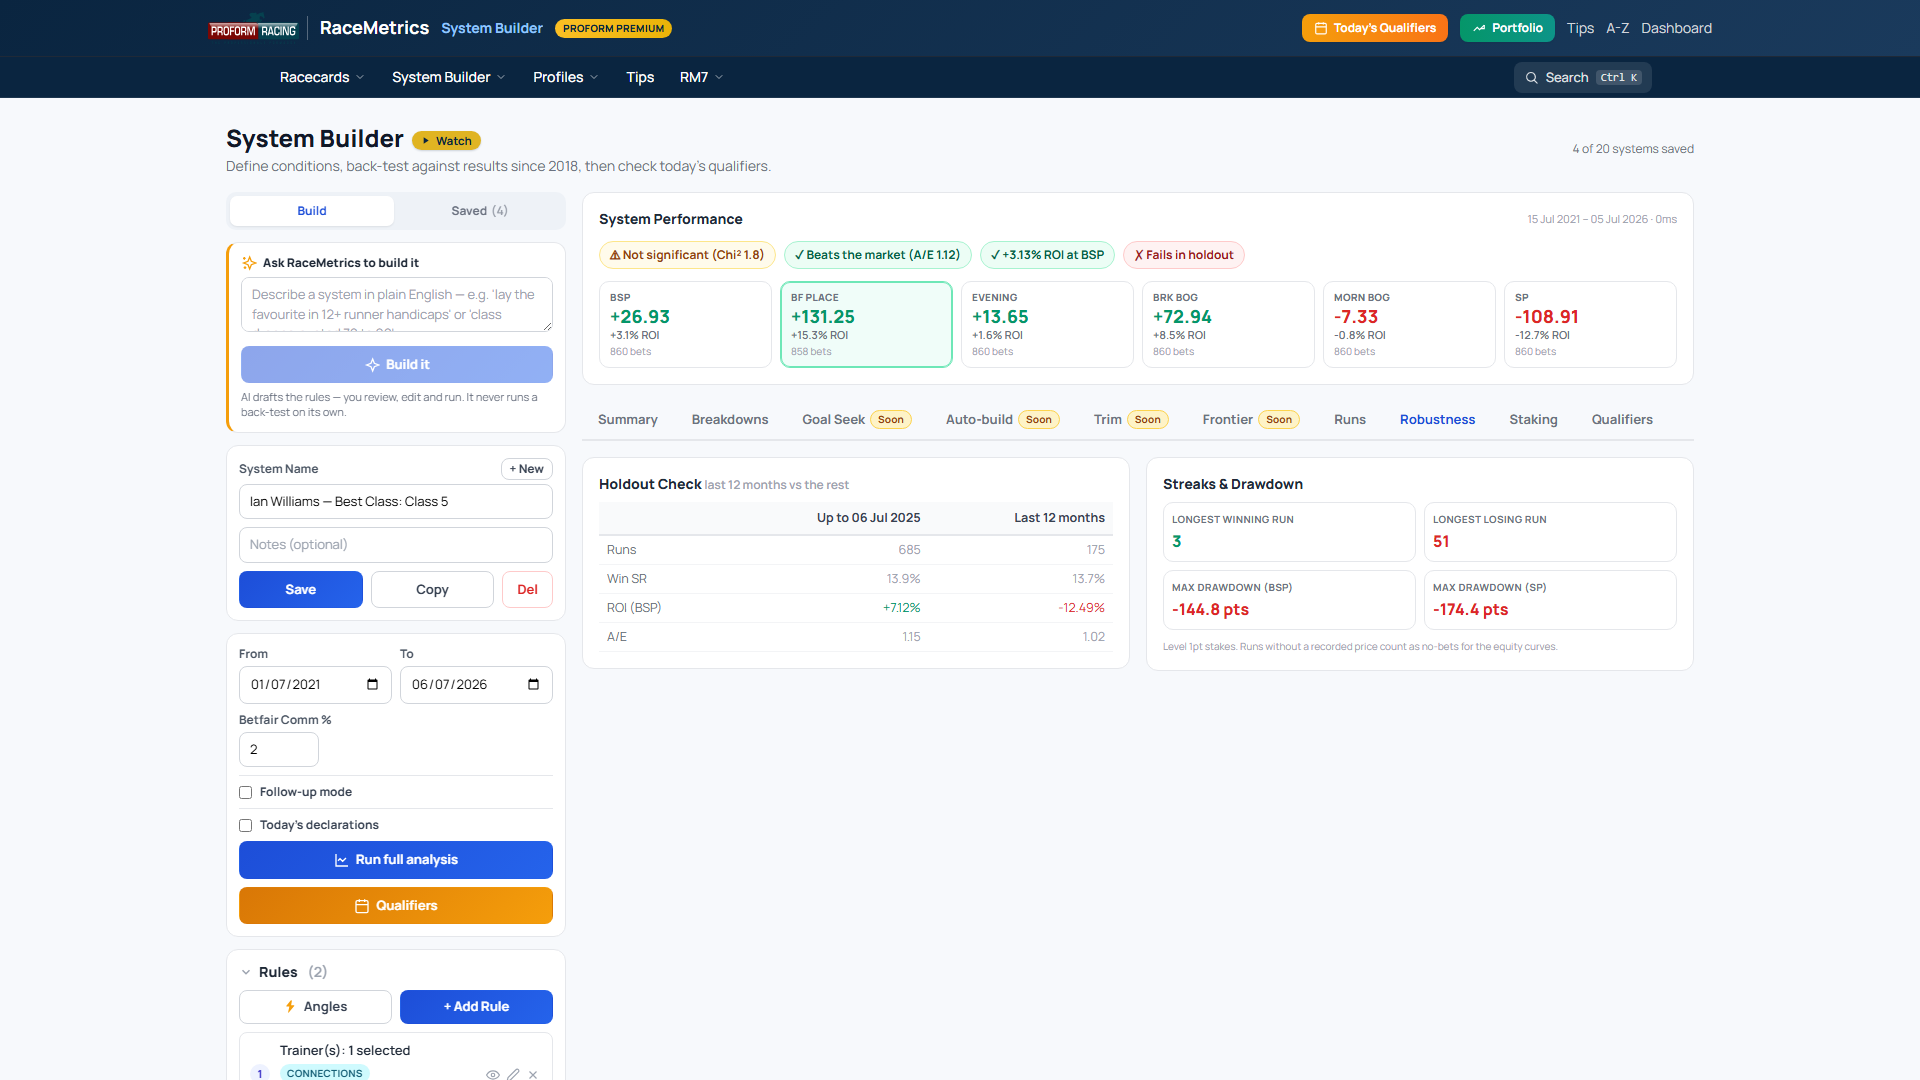
If the edge holds in that unseen period, you can trust the system more. If it flips or fades, the system is probably curve-fitted to history — loosen it (Trim helps) and check again. A plain-English verdict tells you which it is.
Laying? The same checks, read the other way round
If your system is built to lay its qualifiers rather than back them, the Robustness tab now reads both ways. The holdout table carries Lay ROI (BSP) and Lay Place ROI rows — the same train-versus-last-12-months comparison on the lay P/L — each with its own verdict badge, so a lay angle gets the same over-fitting defence a back angle does. And the Streaks & Drawdown card shows Max Drawdown (Lay) and Max Drawdown (Lay Place): the worst peak-to-trough fall of the lay equity curves at 1pt backer stakes. One thing to keep straight: a lay's losing run is the winning run shown above — a lay loses when the horse wins.
Random data splits — a second opinion
The Data setting (next to the dates) gives you a different kind of check. Instead of splitting by time, it splits your history randomly by race, and you can do that two ways. Half A / Half B cuts the history into two equal halves. Train 80% / Test 20% holds back a random fifth of the races instead — the split machine-learning practitioners usually reach for, because it leaves 80% of the data to actually build with while still keeping a meaningful untouched sample for the final check. Both splits are deterministic: a given race always lands in the same bucket, so the buckets never overlap and never change between runs.
The workflow is the same either way: build and tune on one side (Half A, or Train 80%), then switch the setting to the other side (Half B, or Test 20%) and run it again. That other side is thousands of races your tuning never touched — if the edge shows up there too, it's far more likely to be real. Which pair to use? The halves give you the biggest untouched sample for the confirmation run; 80/20 keeps more data in the building phase, which matters when your angle is naturally narrow and every run counts. Because these splits are random rather than time-based, they complement the holdout: the holdout asks "does the edge survive into the recent past?", while a random split asks "does the edge exist beyond the exact races I tuned on?". A system that passes both is on solid ground.
Going live
A profitable angle is only half the job — how you stake it decides the real return and how bumpy the ride is. The Staking tab takes the exact set of bets your system found and re-runs them under ten different staking plans, all from the same starting bank, so you can compare them fairly.
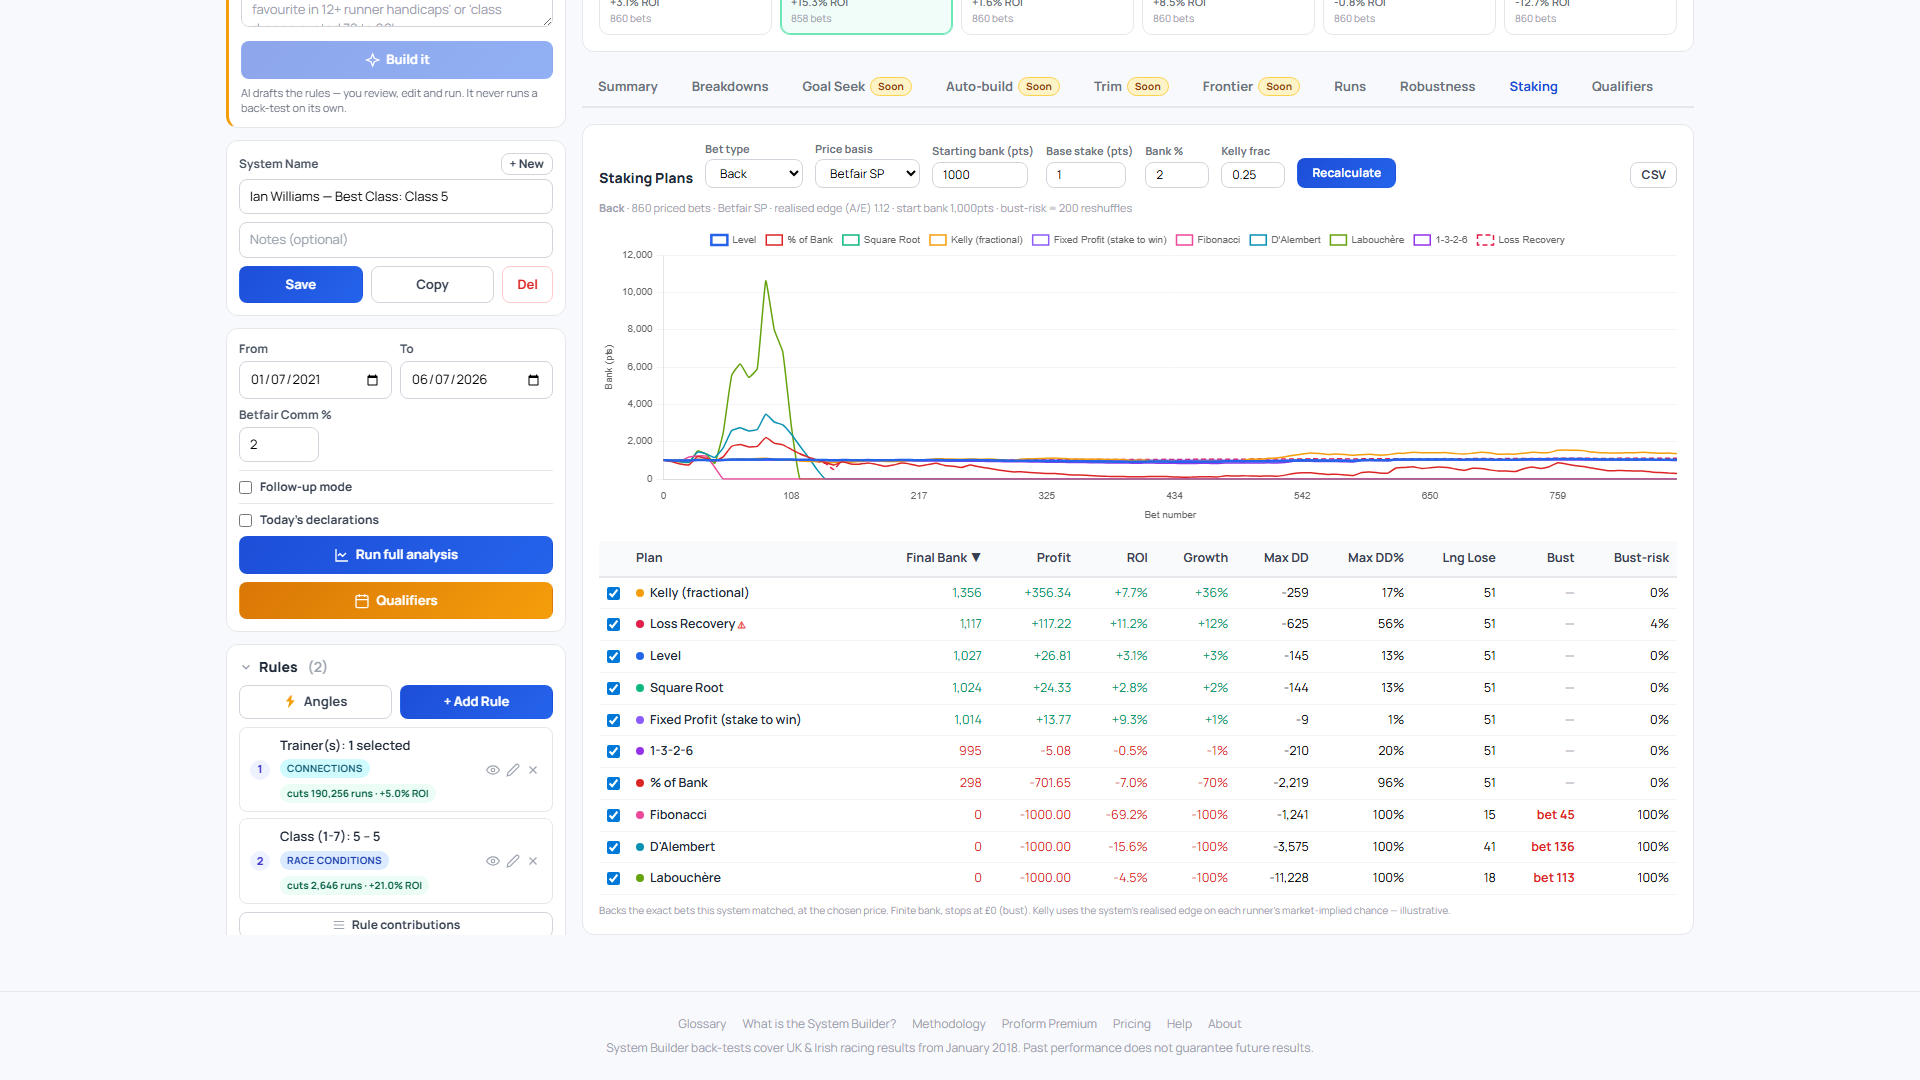
For each plan you get the bank curve, final profit, ROI, the worst drawdown, the longest losing run, and a bust risk (how often it would have wiped out the bank). For the full detail of how each plan works — and which are safe and which are dangerous — see The 10 staking plans, explained.
Once your system has found a set of bets, the next question is the one that actually decides whether you make money: how much do you put on each one? That choice is called a staking plan. The Staking tab lets you take the exact bets your system found and replay them under ten different staking plans, side by side, so you can see which one would have grown your money best — and which would have wiped you out.
Before the plans themselves, it helps to learn five words. Bankroll (or "bank") is the pot of money you're betting with. A stake is the amount you put on a single bet. Level stakes means betting the same fixed amount every single time (the simplest possible plan). A drawdown is how far your bank falls from its highest point before it recovers — the size of the worst losing patch. And to go bust means your bank hits zero and you can't bet any more.
The shared model — how the comparison works
Every plan is tested on identical terms so the comparison is fair:
- Same bets, same order. All ten plans replay the exact same list of bets your system found, in the real date order they happened. Nothing is cherry-picked — only the stake size changes between plans.
- Same starting bank. Each plan begins from one finite starting bank (default £100). That's what makes it a true contest: a plan that needs a huge bank to survive will show its true cost.
- You can never stake more than you hold. If a plan wants to bet £150 but your bank is only £80, it stakes £80. And if the bank reaches zero, that plan has gone bust and stops betting for the rest of the run — its line on the chart goes flat. This is the standard staking-simulator model (the same one used by sites like thestakingmachine.com), and it's exactly what exposes the dangerous plans.
For each plan you get back: the final bank and profit, the ROI (return on the total amount staked), the worst drawdown (in pounds and as a %), the longest losing run (most consecutive losing bets), whether it went bust (and at which bet), and a bank curve you can chart. There's also an edge number for the whole cohort: the system's actual wins divided by the wins the market "expected" — above 1.0 means your selections beat the market. That edge feeds the Kelly plan.
Level / fixed — the baseline
- Level — The same stake on every bet, full stop. The formula is simply
stake = base stake. Good at: being a clean, honest yardstick — if a fancier plan can't beat Level, the fancier plan isn't earning its risk. Risk: none beyond the bets themselves; it never chases losses and never over-reaches. Who it suits: everyone, as the benchmark you judge the others against. You'd use this to answer "does my system actually make money flat-staked?" before worrying about anything cleverer.
Proportional — stakes that follow your bank
These plans bet a slice of whatever your bank currently is. When you're winning, the bank grows so your stakes grow (this is called "compounding"). When you're losing, the bank shrinks so your stakes automatically shrink too — a built-in safety brake.
- % of Bank — Stake a fixed percentage of the current bank every time:
stake = bank × (pct ÷ 100). At 2%, a £100 bank bets £2; grow the bank to £200 and the same 2% now bets £4. Good at: compounding a genuine edge while easing off through bad patches — you literally cannot go fully bust at a fixed % (each bet only risks a slice). Risk: a high % can still give brutal drawdowns, and stakes balloon in winning runs. Who it suits: anyone who wants growth that scales with success without micro-managing it. - Square Root — Stakes rise with the square root of how much the bank has grown:
stake = base stake × √(bank ÷ starting bank). Double your bank and the stake only goes up by about 41%, not 100%. Good at: gentler, calmer compounding than straight % — it presses winners but with the handbrake half-on. Risk: grows the bank more slowly than % of Bank in a hot streak. Who it suits: cautious compounders who find % of Bank too swingy.
Value / Kelly — bet bigger when the edge is bigger
- Kelly (fractional) — Kelly is a famous formula that sizes each bet by how much of an edge you have on it: bigger edge, bigger stake. Here it uses your system's realised edge (the A/E multiplier) applied to each runner's market-implied chance, works out the Kelly-optimal fraction of your bank, and then bets a fraction of that (the Kelly Fraction setting, default a quarter). The formula is the classic
f = (b·p − (1−p)) ÷ b, thenstake = f × Kelly Fraction × bank, wherebis the win-return andpis the edge-adjusted win chance. Good at: theoretically the fastest long-run bank growth if your edge estimate is right. Risk: full Kelly is wild — drawdowns can be savage — which is why you bet a fraction of it. And it's clearly labelled illustrative: true Kelly needs a forward-looking probability model, whereas this leans on the backtest's own edge, so treat it as a guide, not gospel. Who it suits: users who understand the maths and want edge-weighted sizing. (Kelly is switched off for Each-Way bets — see below — because a win-and-place bet has no single odds/probability pair to plug in.)
Fixed-profit — aim for the same payout each time
- Fixed Profit (stake to win) — Instead of staking the same amount, you stake whatever it takes to win the same target amount each time:
stake = target profit ÷ win-return. To win £1, you'd bet £1 on an evens shot but only 25p on a 4/1 shot. Good at: smoothing your returns — short-priced favourites and big-priced outsiders all aim for the same payout, so one lucky longshot doesn't flatter the figures. Risk: on very short prices the stake gets large to win the target, so it can tie up a lot of bank on odds-on runners. Who it suits: people who think in "profit per bet" rather than "stake per bet", and systems that fire at a wide spread of prices.
Progression / recovery — change the stake based on your last result
These plans move the stake up or down depending on whether the last bet won or lost. Some are gentle; some are openly dangerous. The seductive idea behind the dangerous ones is "a win is always around the corner, so raise the stakes after losses to win it all back at once". The maths trap is that a long enough losing run makes the next stake bigger than your whole bank — and then you're bust, with no comeback. Be especially wary of Loss Recovery, and treat Labouchère and Fibonacci with respect.
- Fibonacci — Climb the Fibonacci number sequence (1, 1, 2, 3, 5, 8, 13…) after each loss; snap straight back to the start after any win:
stake = base stake × fib(step), step resets to 0 on a win. Good at: recovering losses more gradually than a straight double-up. Risk: still a chase — a long losing run marches the stake up fast, and the bank-clamp/bust model will catch it if the run is bad enough. Who it suits: recovery fans who want something tamer than Martingale but should still watch the bust column. - D'Alembert — The gentlest progression: go up one unit after a loss and down one unit after a win (never below one unit).
stake = base stake × units. Good at: nudging stakes around losses without the violent escalation of doubling. Risk: mild compared with the others, but it still leans into losing runs, so a long cold spell slowly bleeds the bank. Who it suits: users who want a touch of recovery with low drama. - Labouchère — You write down a short line of numbers (default 1, 1, 1). Each stake is the first plus last number on the line. Win, and you cross both ends off; lose, and you append the amount you just lost to the end of the line. Clear the whole line and you've booked your target, then a fresh line begins. Good at: a structured way to grind out a fixed target. Risk: openly dangerous in spirit — every loss makes the line longer and the stakes bigger, so a bad run snowballs the line until a stake exceeds your bank and you bust. Who it suits: only experienced users who fully grasp how fast that line can grow. You'd use this to see, honestly, how a target-chasing line copes with your system's real losing runs.
- 1-3-2-6 — A four-step winning progression: stake 1 unit, then 3, then 2, then 6 units, riding a hot streak — but reset to the start on any loss or after completing all four steps.
stake = [1,3,2,6][step] × base stake. Good at: pressing winning runs while risking little when you're cold (you're back to 1 unit the moment you lose). Risk: low compared with the loss-chasers, because it escalates on wins, not losses; the cost is that it needs streaks of winners to pay off. Who it suits: users who'd rather let winners run than chase losers. - Loss Recovery (flagged dangerous) — This is the Martingale family. After losing bets it stakes enough to win back everything you've lost so far, plus your target profit, on the very next winner:
stake = (amount owed + target profit) ÷ win-return, with the "owed" pile resetting to zero only when a bet wins. Good at: looking unstoppable on paper — most of the time a winner does come and you recover in one hit. Risk: the highest bust risk of all ten, by a distance. Each loss makes the required recovery stake bigger; a run of, say, eight or ten losers in a row demands a stake far larger than your whole bank, the plan can only put up what's left, and the next winner no longer covers the hole — so the bank flatlines and the plan is bust with no way back. The blurb says it plainly: "High bust risk." Who it suits: realistically, no one for serious money — it's included so you can see for yourself how a real losing run inside your own cohort turns a tempting idea into a wipeout.
The settings — what each control changes
The plans share one set of parameters. Tuning these changes how aggressive every plan is:
- Starting Bank — The pot every plan begins with (default £100; allowed £1 up to £10,000,000). A bigger bank survives longer losing runs before busting, so it flatters the recovery plans — keep it realistic.
- Base Stake — The unit size for the flat and progression plans (default £1; can't exceed your starting bank). Level, Square Root, Fibonacci, D'Alembert, Labouchère and 1-3-2-6 all build their stake off this.
- % of Bank — The percentage used by the % of Bank plan (default 2%, range 0.1%–100%). Higher = faster growth and deeper drawdowns.
- Kelly Fraction — What slice of the full Kelly stake to actually bet (default 0.25, i.e. quarter-Kelly; range 0.01–1). Lower is safer; 1 is full Kelly and very swingy.
- Target Profit — The amount the Fixed-Profit and Loss-Recovery plans aim to win on a successful bet (default £1; capped at your starting bank).
- Labouchère Line — The starting list of numbers for Labouchère (default 1, 1, 1; up to 20 numbers, each 0.01–1000). A longer or larger line means a bigger target and bigger stakes.
- Commission — Your Betfair commission rate, taken off winning exchange returns (default 0, up to 0.5 i.e. 50%). It only applies on the BSP price basis; Industry SP has no commission.
- Max Stake Cap — An optional ceiling on any single stake (default 0 = no cap). Set a cap and no plan can ever bet more than that on one race — the single most effective brake on the dangerous progressions, because it stops a recovery stake from exploding.
Back, Lay, Lay the Place, Each-Way, DOB and TROB — and the bust-risk simulation
You can run the staking comparison in six betting modes, and the engine rebuilds each bet's outcome to match:
- Back — The normal bet: you back the horse to win. Stake £1, collect the odds if it wins, lose the £1 if it doesn't.
- Lay — You bet against the horse (you win if it loses). Here the "stake" the plans size is your liability — the amount at risk if the horse wins. A successful lay wins a small amount relative to that liability, while a loss costs the full liability, so the risk profile is flipped from backing.
- Lay the Place — You lay the horse in the Betfair place market: the bet wins when the horse misses the places, and loses the liability when it places. Place prices are much shorter than win prices, so the liability per bet is smaller but the "horse places" outcome lands far more often — a genuinely different risk shape from laying the win market. Lay the Place forces the BSP price basis (it's an exchange-only market).
- Each-Way — Half your stake on the win market and half on the place market (using Betfair's place price). A winner collects both halves, a placed horse collects just the place half, and an also-ran loses both. Each-Way forces the BSP price basis, and Kelly is omitted (a win-and-place bet has no single odds/probability to feed it).
- Double Or Bust (DOB) — A popular in-running trade: back the horse at Betfair SP, then offer a lay at half the decimal odds in running. If the price ever trades at half (or lower), the trade is matched and you've locked in +1 point profit whatever the result — even if the horse then fades, or falls. If the price never halves, the bet is a full loss (that's the "or Bust") — even when the horse goes on to win: the lay never matched, and the strict DOB convention books the loss. The whole game is the hit rate: at 2% commission you need 50.51% of bets to halve just to break even, and the tab shows your system's hit rate against that break-even line front and centre. Runners below decimal 2.02 are excluded from the count entirely (Betfair's minimum price is 1.01, so the lay leg is impossible — they're not counted as losers). DOB is back-test only: in-running prices exist only after the race is run, so a DOB result can never be known in advance — your system's selections are still perfectly live-usable, this mode just shows how they would have settled. It also assumes your lay was matched at the target price. Kelly is omitted (there's no quoted market for "will it halve").
- Treble Or Bust (TROB) — The same trade at a third of the decimal odds: a hit locks in +2 points, a miss loses the stake. The price has to drop further, so hits are rarer but pay double — break-even is 33.78% at 2% commission. Runners below decimal 3.03 are excluded, and everything else about DOB (back-test only, lay assumed matched, strict miss, no Kelly) applies the same way.
Finally, the Monte-Carlo bust-risk check. Recovery and progression plans are path-dependent — their fate depends on the order the wins and losses arrive in, not just how many there were. The real history is only one possible order, and it might have been lucky. So Monte-Carlo reshuffles your exact set of bets into a new random order many times over (default 200 shuffles) and re-runs every plan each time, recording how often each plan went bust and its median final bank. A plan that finished in profit on the real timeline but busts in, say, 30% of the reshuffles is telling you it survived on luck, not strength. (The simulation is skipped automatically for very large cohorts — over 25,000 bets — to keep it fast.) Use the bust-probability column as your reality check before ever trusting a recovery plan.
Once a system is proven, the Qualifiers tab shows which of today's, tomorrow's or the next two days' declared runners match its pre-race rules — your system, running live.
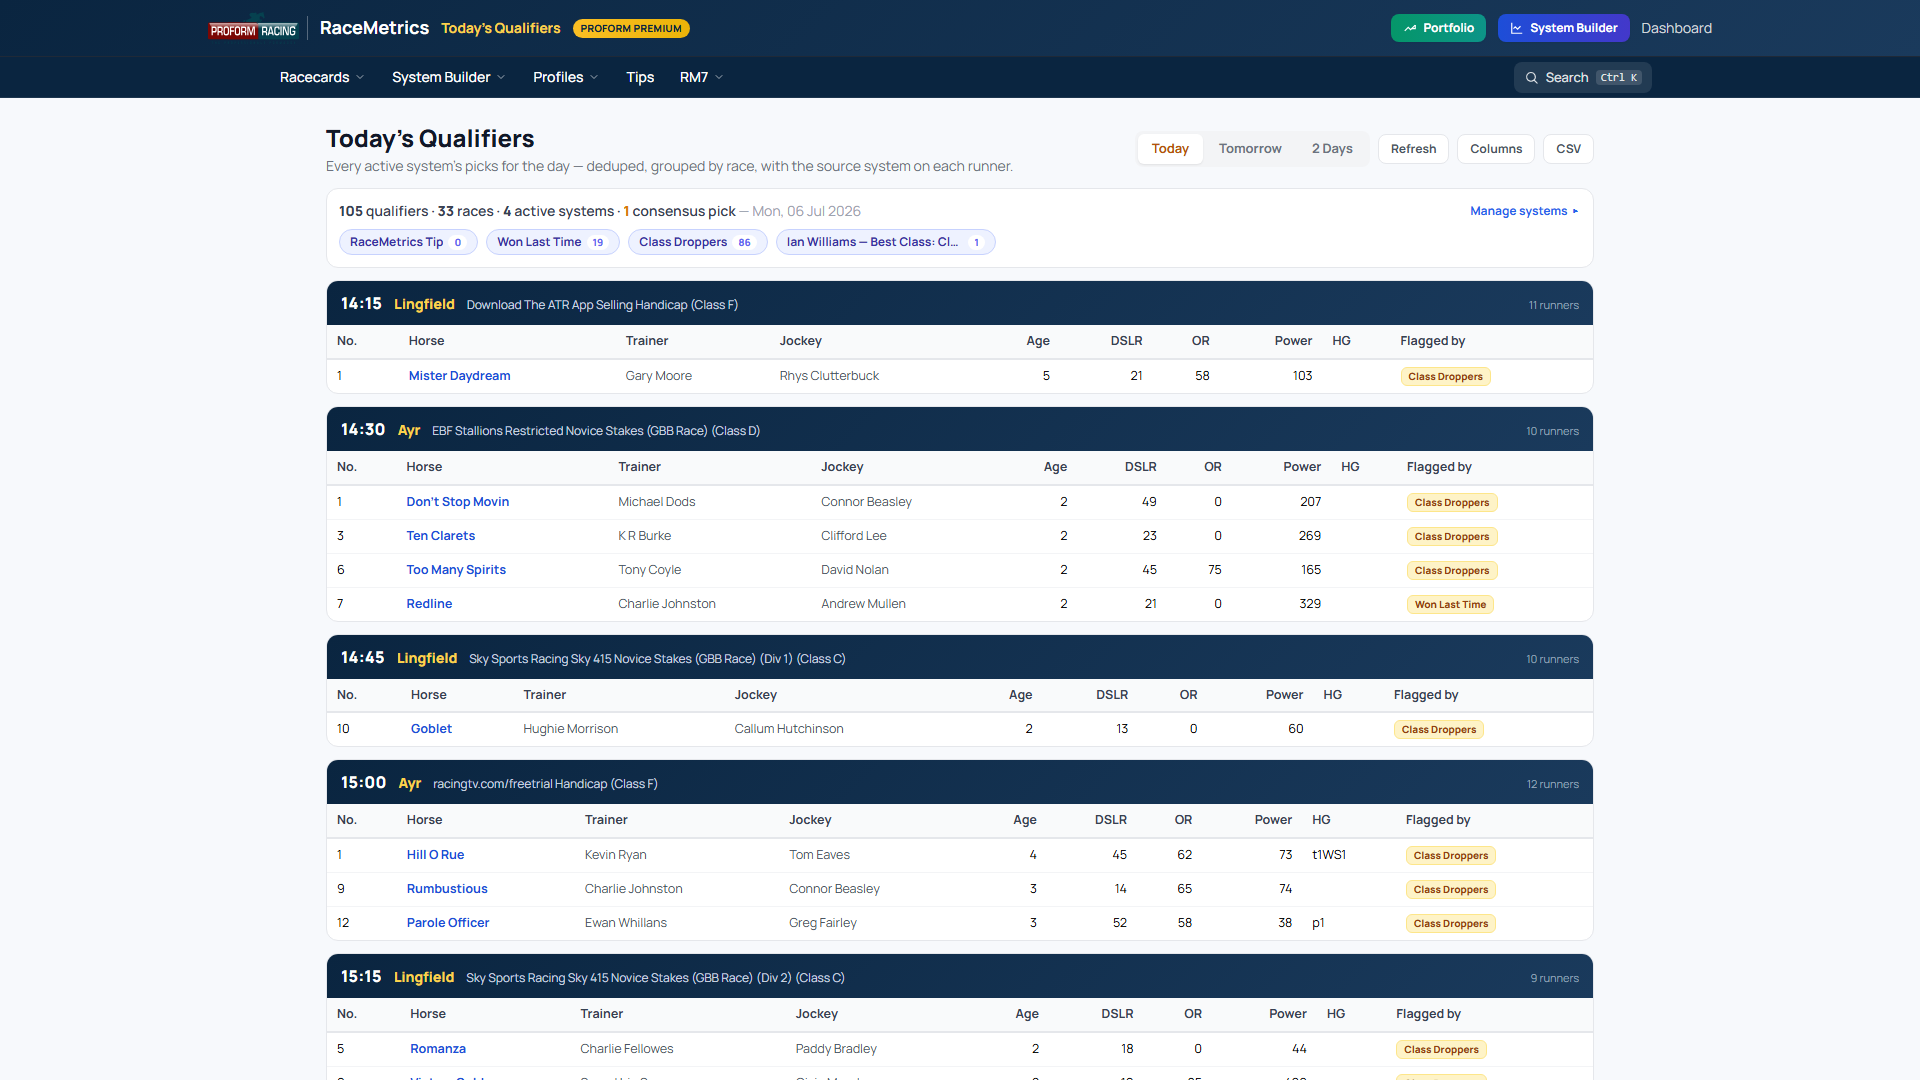
- Cross-system hub — a single page showing the qualifiers from every one of your active systems, deduplicated and grouped by off-time, with a badge for which system flagged each runner.
- Yesterday tab — the same page for yesterday, with the results: finishing position, SP, BSP, and profit/loss per runner (level 1pt at Betfair SP, 2% commission), a settled-day total, and a per-system record so you can see which of your angles delivered. It re-runs each system's current rules against yesterday's races — so if you've edited a system since the morning, the Yesterday view reflects the edit.
- Racecard badges — flagged runners are badged on the racecard so you spot them while reading the form.
Only pre-race rules can be checked for upcoming runners — anything that depends on the result (like today's finishing position) is for back-testing only, and those systems simply won't produce qualifiers.
Get them emailed to you
You don't have to remember to check — but these emails are off until you ask for them. To start receiving them, tick Qualifier Emails on your Account page (under email preferences), or flip the "Email me these every morning" toggle on the qualifiers hub. Nothing is sent until you do. Once it's on, your active systems' picks arrive in your inbox each morning, around 8am, grouped by off-time with a badge for which system flagged each runner. Quiet days stay quiet: you're only emailed when something actually qualifies, and you can untick the box any time to stop.
Racing changes through the day, though. Fresh prices arrive after the morning email (a price-comparison rule can suddenly match), and non-runners shrink the field, shift every rank and re-shuffle the stalls draw (the stalls close up on course when a horse is withdrawn, so the surviving runners are renumbered — exactly as the result will record them). Either way, a horse that didn't qualify at 8am can be pulled into one of your systems by lunchtime — or drop out of one. When that happens you get a short follow-up email with the new qualifiers, a "now also qualifies" list for any runner you already had that another of your systems has since picked up, and a "no longer qualify" list for any morning pick that has since been scratched or moved outside your rules, for races still to be run, so neither a late mover nor a dead pick slips past you. It's the same single opt-in, and it's capped so a busy day of price moves and withdrawals can't flood your inbox.
Save a system to keep it, run it again any time, and feed it into the qualifiers hub. Each saved card shows its last back-test summary at a glance, so your library is scannable.
- Save, duplicate, rename — build a library of angles. Proform Premium members can save 1,000 systems; RaceMetrics Pro members 50. The counter above your saved list shows where you are.
- Active toggle — only active systems feed the cross-system qualifiers hub, so you can mute an angle without deleting it. Whatever you have saved, the hub runs your 50 most-recently-updated active systems each time — it works through them one at a time, and beyond fifty you would be waiting rather than reading. If you have more than fifty active it tells you so on the page, and the Active toggle is how you choose which fifty.
- Live record — "since you saved this" re-runs the system from its save date, so you can see how it's actually done since you started following it — the honest test of a system.
- Recent record — on the Qualifiers hub, click a system's name in the manage list for its last 7 days, 30 days and 12 months (and since it was saved): bets, winners, strike rate, places, level-stakes P/L and ROI at Betfair SP after commission, and A/E — settled results only, from the same engine as the builder's own Run, so the two always agree. The hub's Report button lays every active system out side by side for the same three windows with a totals row, and Copy summary gives you a one-line record ("12 bets, 4 winners, +6.2 pts at Betfair SP — settled results, not tips") to paste anywhere. ROI is greyed until a window holds 30 bets: fewer than that is a count, not an edge. Research systems are welcome here too: a system that uses rules only known once the race is run (Betfair SP, the favourite, run style, actual going, an earned My Rating and so on) still gets its full record, tagged research, because the daily qualifiers can't apply those rules as tested. Its summary line says "research back-test" instead of "settled results, not tips". For My Ratings, the "(pre-race)" versions of My Rating, My Rating Rank and My Rating minus OR give a record of bets you could have made.
- Performance targets — set a goal on any saved card and track its real results against it. Covered in full in the next topic, Performance targets.
- Export / Import — share a system with another member as a small file. See below.
Sharing systems
The Export button (under Save) downloads the current system — its rules, dates, commission and follow-up setting — as a small file named after the system. Send that file to anyone by email, Telegram or the forum; it contains only the recipe, never your results, notes stay optional, and your personal bits (performance target, data split, research scope) are left out.
Import does the reverse: pick a file someone sent you and the system loads into your builder, unsaved, ready to back-test — so you can inspect exactly what it does before deciding to keep it. Imports are checked against the current filter catalogue: any rule this builder doesn't recognise is skipped and the import tells you how many loaded. Importing never overwrites your saved systems, and an imported system doesn't count against your limit until you choose to save it.
If your plan changes
Nothing you have built is ever deleted. If you move to a plan with a smaller allowance — or your subscription lapses and you come back on a different one — every system you saved is still there, and you can still run it, edit it, export it and delete it. The only thing the allowance ever stops is saving a new one: if you are above it, you would need to come back under before adding another. We will never remove a system to make the number fit.
A back-test tells you what a system would have done. A target holds it to account for what it actually does from here. Click the small target button on any saved card to set one — the card then tracks the system's live results against your goal, and tells you whether it's on pace.
Setting a target
Pick a measure, a number, and (optionally) a deadline:
- BSP profit (pts) — points profit at Betfair SP to level stakes. The most natural target for most people: "make me +50 points".
- BSP ROI (%) — return on investment at BSP. A quality target rather than a quantity one — it doesn't grow with volume, so it suits "keep the edge above 5%" thinking.
- Winners — a simple count. Good for high-volume systems where the pleasure is in the winners as much as the profit.
- Strike rate (%) — wins ÷ runs. Like ROI, a quality bar rather than a running total.
- A/E (BSP) — for the value purists: hold the system to beating the market's expectation, whatever the raw profit does.
How progress is measured — the honest window
Progress uses the system's live record, never the back-test, and it counts from the day you set the target. Setting a target today on a system you saved months ago does not inherit its past results — good or bad. The clock starts when the commitment does.
- Checking progress — click Progress on the card. You'll see the running value against the target, a progress bar, and days left if you set a deadline.
- On pace / behind pace — with a deadline set, cumulative targets (profit, winners) get a straight-line pace check: if a third of the time has passed, are you a third of the way there? The bar turns amber when you're behind and green when the target is met.
- Changing the target — tweaking the number keeps your original start date (no cheating the clock by re-setting it after a bad week). Switching to a different measure restarts the clock, because the old progress isn't comparable.
- Removing it — open the target dialog and remove; the card goes back to the plain live record.
Your targets also show against each system in the qualifiers hub's manage list, so the goal stays in view where you pick your bets.
Advanced
One good system is fine; several that win at different times are better, because they smooth each other out. The Portfolio & Compare tool lets you pick two to six saved systems and study them together.
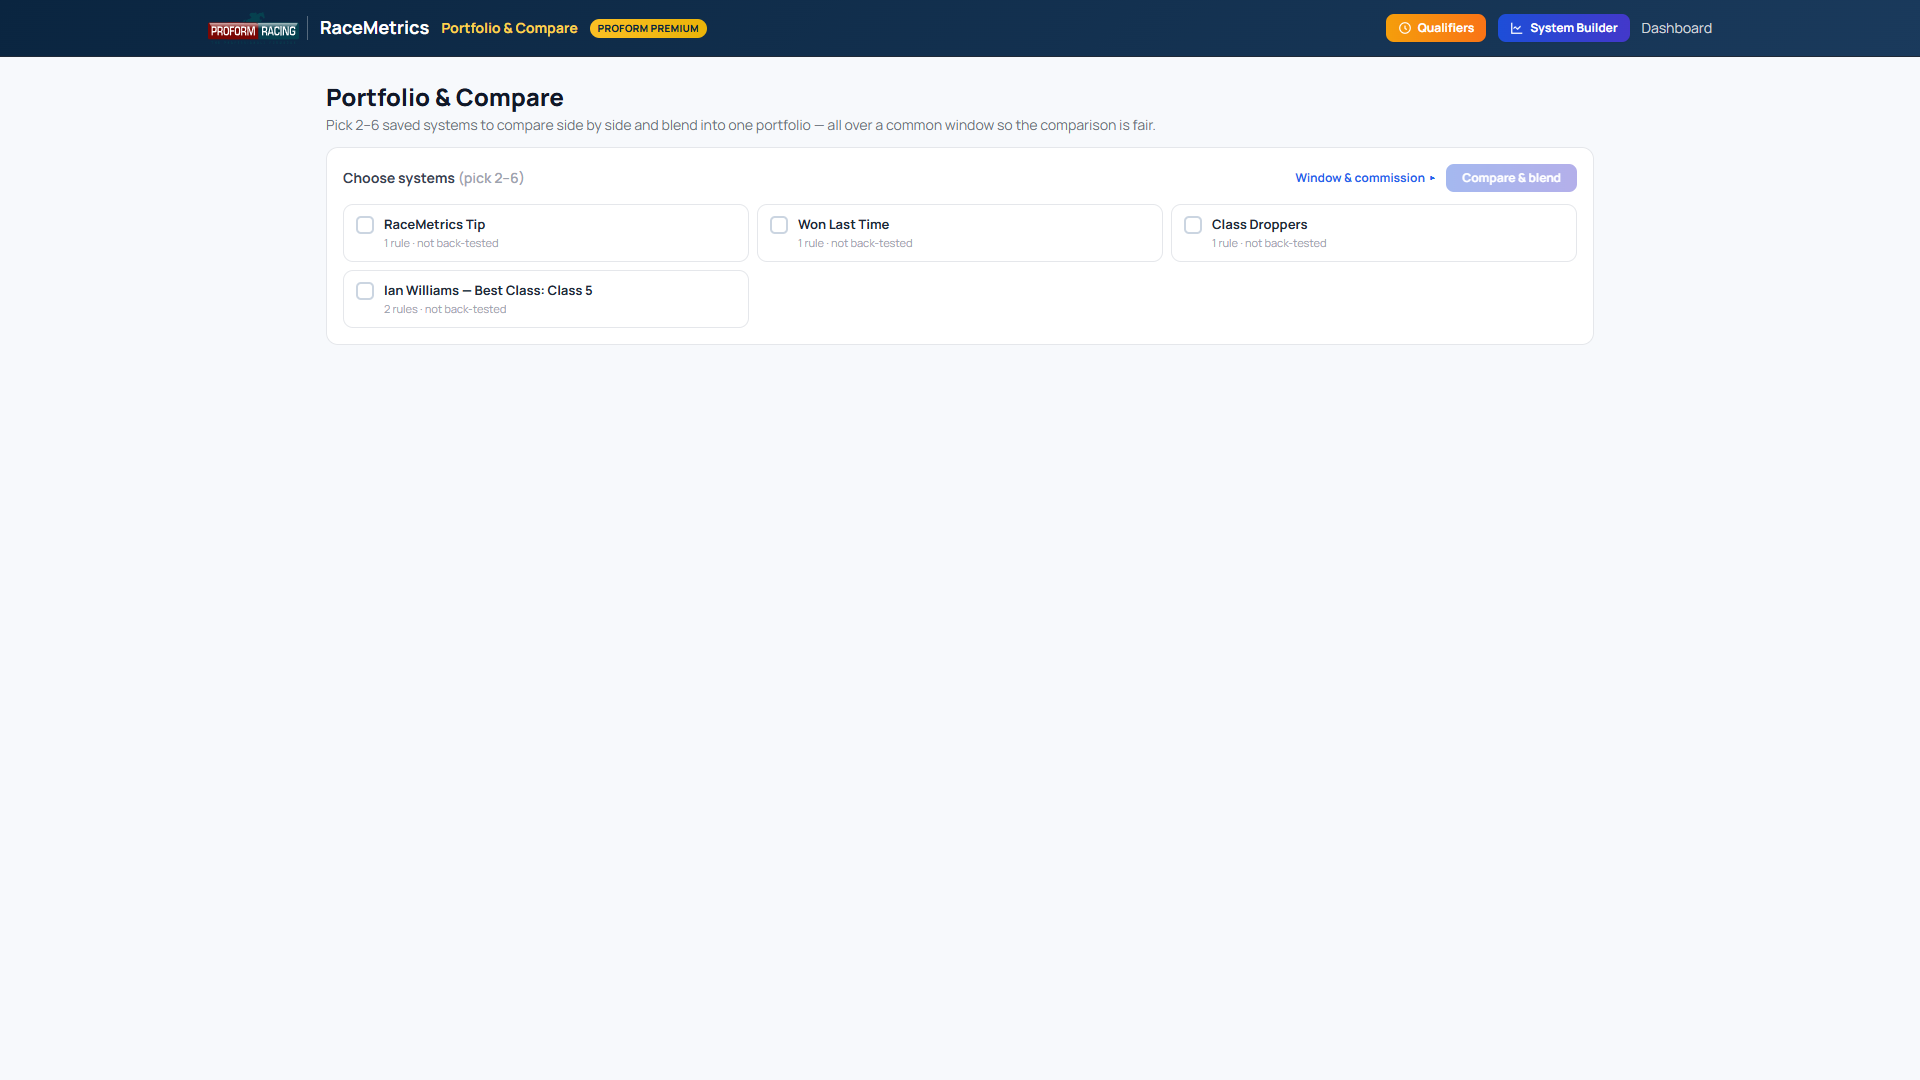
- Compare — their stats side by side, their bank curves overlaid, and a correlation matrix showing how alike their returns are (low correlation = they don't lose at the same time, which is good).
- Choose what the curves show — the Show box above the chart switches the lines between P/L (Betfair SP, Industry SP, BSP place, evening and BOG prices), running total of bets, ROI, strike rate, A/E and impact value. A money figure builds up month by month; a rate is recalculated across everything up to that month, so it wanders early and then settles — a rate line only begins once there are enough bets behind it to mean anything. On a rate, the scale is fitted to where most of the data sits, so a system that had a brutal start can run off the bottom of the chart and come back; hover any point for its exact figure.
- Compare two periods — pick a span of months for A and another for B and every system is shown side by side on both, with the change between them. The usual question is whether a system is still doing what it did: put its early run in A and its recent run in B. Splits are by whole month, because that is how the back-test groups results.
- Blend — it merges the chosen systems into one combined portfolio (the union of their qualifiers, with duplicates removed) and gives a turnover-adjusted drawdown verdict, so you can see whether running them together is steadier than any one alone.
- All bets — below the blend, a table of every individual bet any selected system flagged over the common window, newest first. A runner two systems both like appears once, tagged with a coloured dot for each system that flagged it. Choose your columns (the same catalogue as the back-test runs drill-down) and download the whole list as a CSV — the spreadsheet gets a Systems column naming which of your systems picked each bet.
If you have the Sectionals add-on, the System Builder unlocks a set of filters and breakdowns built from sectional timing — measuring how a race was run, segment by segment, not just the finishing order. They let you build systems around a horse's running style and physical profile.
Examples include gate speed (how quickly a horse breaks and travels early), Distance DNA (whether its stride pattern says it wants further or shorter than today's trip), places gained after the sectional upgrade, finishing speed, and finishing speed efficiency — how close to par pace a horse ran last time, as a figure and as a rank within that race (1st = the most efficiently run horse in the field). For the full list, see the Sectionals filters.
Some answers in Ask RaceMetrics — the natural-language query tool, where you ask a question in plain English — can be opened straight into the System Builder as a starting system. There are two ways across:
- Open in System Builder — when your question matches one of the built-in angles (class droppers, last-time-out winners, first-time headgear and the like), that exact set of rules loads in one click.
- Build this as a System — for any profit / ROI question, this sends your wording to the builder's Ask box, which drafts the rules for you to review and run.
Either way you go from a question to a back-testable, saveable, live-trackable system — and every breakdown and staking plan is then free to explore, instead of asking a fresh question for each cut.