
Who can use it: Enterprise and above.
Market Movers is a dedicated racecard tab that shows the full daily price walk for every runner — Evening → Breakfast → Morning, plus BSP (Betfair Starting Price) for races that have already been run. Each price snapshot is shown three ways at once (fractional, decimal, implied probability), and three movement columns with colour bands surface who is being backed and who is drifting at a glance.
When the race has been priced by the model, an RMP group also appears before Evening — the RaceMetrics Model Price, a fair 100% book struck each morning — along with a Mkt vs RMP column (how far the latest market price sits from the model, with the bookies’ margin removed first — the way a real book carries it, heaviest on the outsiders and lightest on the favourite, rather than spread evenly) and, on settled races, BSP vs RMP. The Book % pill under RMP always reads 100.0, because a fair book carries no margin at all.
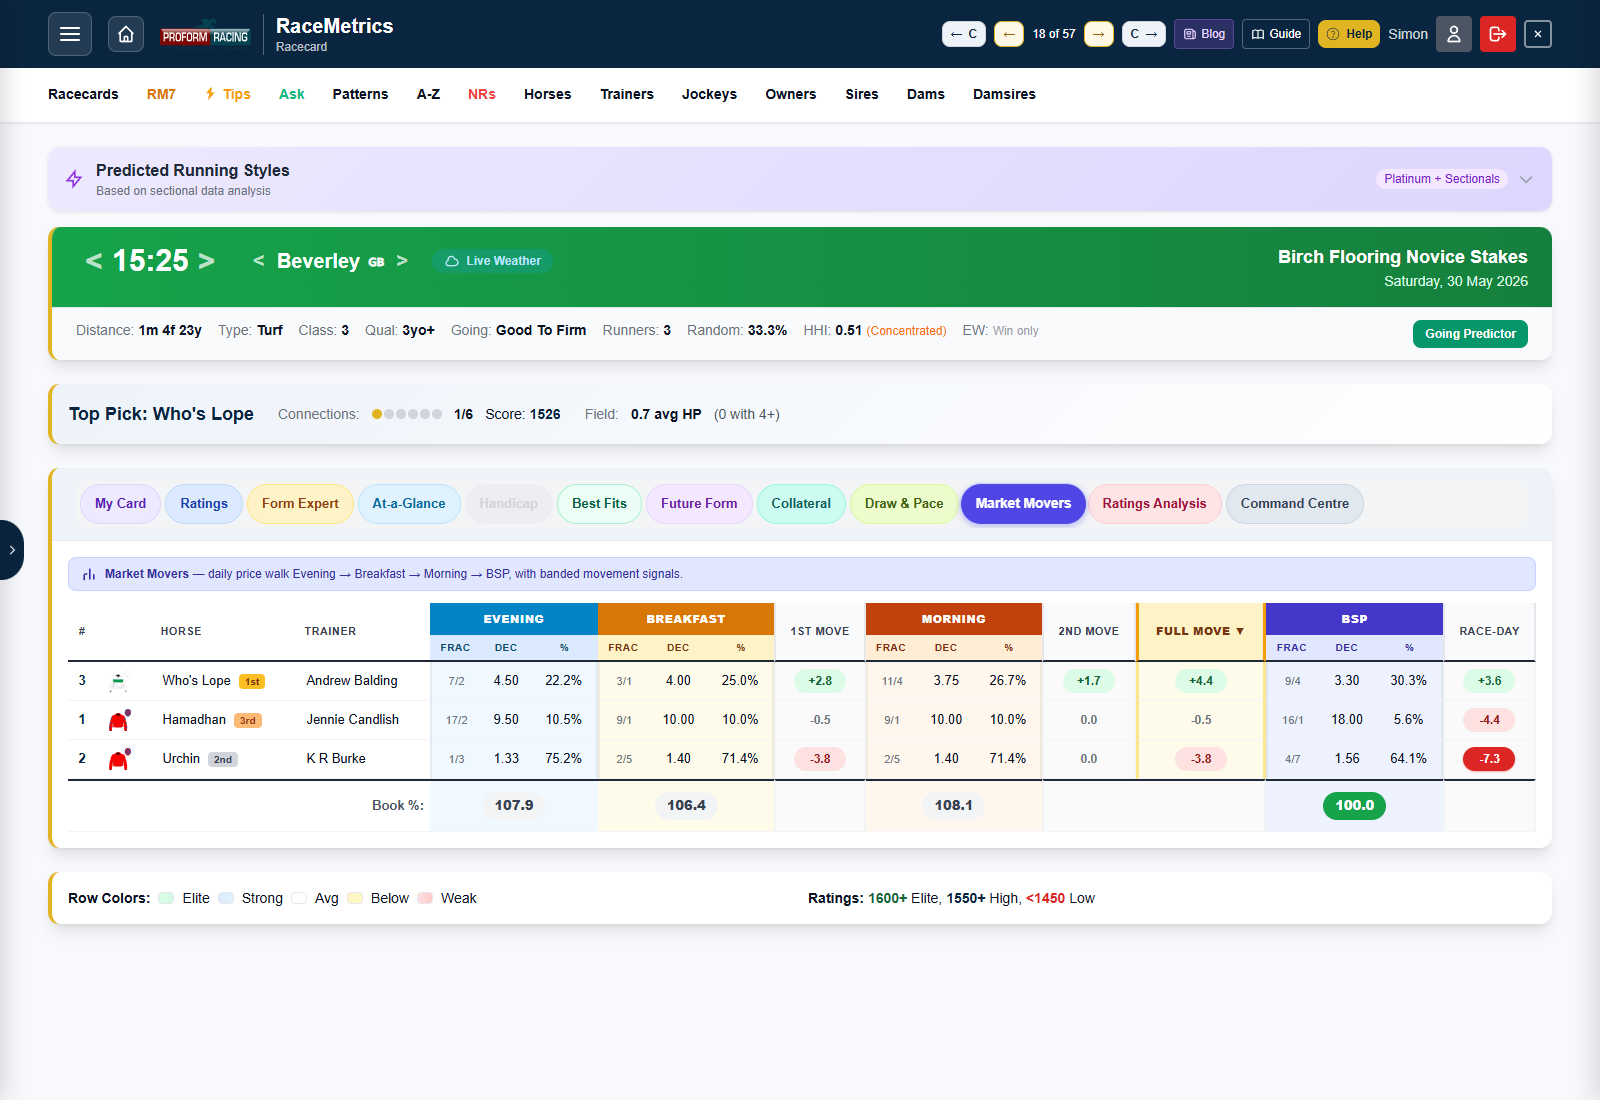
What you'll see at a glance
- Three coloured group headers across the top — Evening (sky), Breakfast (amber), Morning (sunset orange) — and a fourth (BSP, indigo) when the race has been run.
- Underneath each header, three sub-columns: Frac (the price as a bookmaker fraction, e.g. 9/4), Dec (the full decimal odds), and % (implied probability = 100 / decimal).
- Between the price blocks, narrow Move columns showing the percentage-point shift between snapshots, banded in green (steaming) or red (drifting).
- A Full Move column at the end, highlighted in amber, summarising the total shift from Evening to Morning — the headline movement signal.
- A bottom Book % footer summing each period's implied probabilities so you can see the bookies' margin tightening into off-time.
- From the 10.30am prices, a Market history link under the trainer of any horse that has moved 5 points or more since 8.30pm, showing what the same move did before for the yard and the horse. See Market Movers for the day.
Movement bands — the colour legend
Every Move cell shows the change in implied probability in percentage points, not percent. A horse going from Evening 20% to Morning 25% has moved +5 pp, regardless of the underlying price.
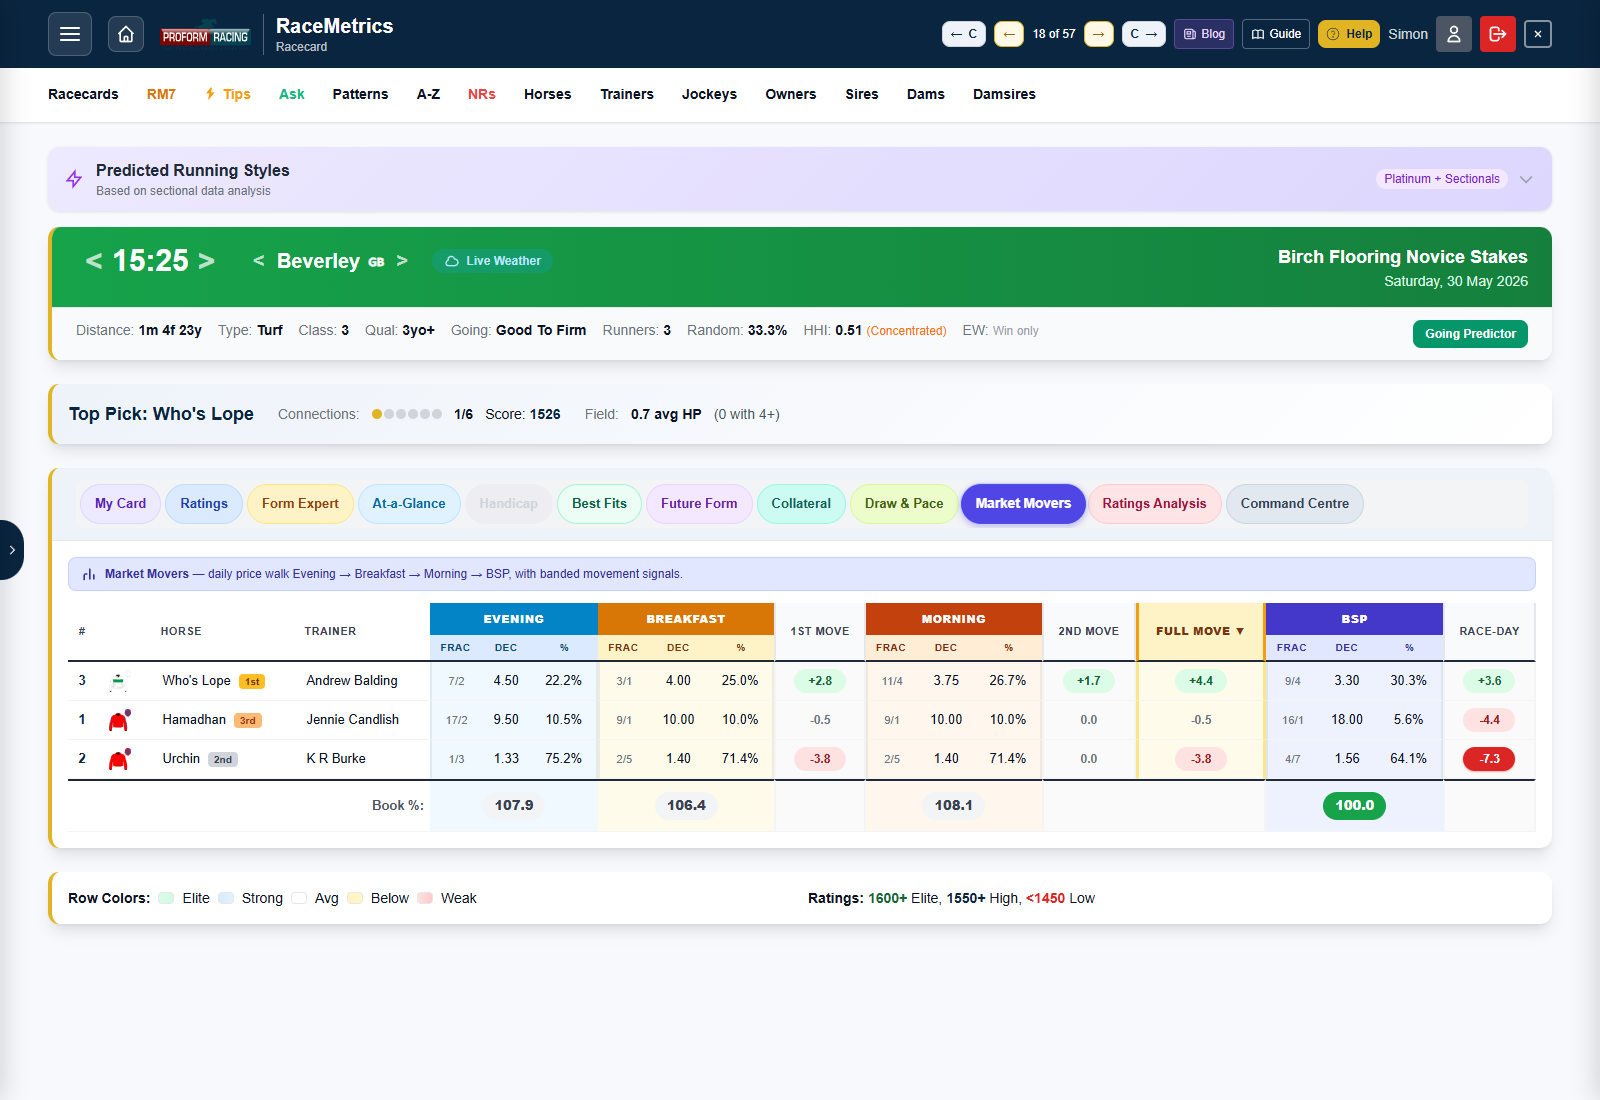
| Band | Range | Meaning |
|---|---|---|
| Strong steamer | ≥ +10 pp | Heavily backed — serious money has been wagered on this horse |
| Medium steamer | +5 to +10 pp | Notable support — clearly being supported |
| Mild steamer | +1 to +5 pp | Lightly backed |
| Negligible | −1 to +1 pp | No meaningful movement — price has held firm |
| Mild drifter | −1 to −5 pp | Lightly opposed — price has eased a touch |
| Strong drifter | ≤ −5 pp | Heavily opposed — the market doesn't fancy it |
The three Move columns
- 1st Move — Breakfast % minus Evening %. The first reaction after the overnight prices were posted.
- 2nd Move — Morning % minus Breakfast %. The morning shift — often the most informative window because race-day backers and serious money come in here.
- Full Move — Morning % minus Evening %. The aggregate signal — the table defaults to sorting by this column so the biggest steamers float to the top.
When the race is over, an additional Race-day column appears showing BSP % minus Morning % — how much the price moved between the last morning snapshot and where it actually settled at off-time.
Book % footer — the overround
The bottom row sums every runner's implied probability for each period. In a perfectly fair market that total would be 100%. Bookmakers build in an overround (margin) above that, which is why most Evening books sit somewhere in the 110–125% range and tighten as off-time approaches.
| Band | Book % | Reading |
|---|---|---|
| Sharp | ≤ 105 | Very competitive market – little margin; common near the off and at BSP |
| Standard | 105 – 115 | Typical race-day bookmaker book percentage |
| Juicy | 115 – 125 | Above-average margin; common in early markets |
| Wide | > 125 | High-margin market with poor value; often seen in early prices, weaker markets, or races with greater uncertainty |
Field size matters — Margin per Runner
Same Book %, very different market. A 120% book in a 3-runner novice chase is brutal; the same 120% in a 20-runner handicap is fairly competitive. Bookmakers stack margin per runner, so bigger fields naturally accumulate more total overround.
| Runners | Book % | Reading |
|---|---|---|
| 3 | 120% | Extremely poor market |
| 8 | 120% | Quite normal early market |
| 20 | 120% | Fairly competitive market |
Underneath each Book % cell, RaceMetrics shows the Margin per Runner — the same number normalised for field size:
Margin per Runner = (Book % − 100) ÷ Runners
Reading the two numbers together gives a much sharper picture: 115% in a 5-runner novice (3.0% per runner) is expensive, but 115% in a 20-runner handicap (0.75% per runner) is sharp.
| Band | Margin/Runner | Reading |
|---|---|---|
| Sharp | ≤ 1% | Very competitive, low margin |
| Competitive | 1 – 2% | Tighter than typical |
| Standard | 2 – 3% | Normal race-day per-runner margin |
| Expensive | 3 – 4% | Wider than typical — common in small fields |
| Very expensive | > 4% | Heavy per-runner margin — usually tiny fields or weak / uncertain markets |
Where the data comes from
RaceMetrics ingests price snapshots three times a day, then settles with the official Betfair SP after the race:
| Snapshot | Imported at | Notes |
|---|---|---|
| Evening | ~ 8:32 pm the night before | Overnight bookmaker prices for tomorrow's races |
| Breakfast | ~ 7:32 am race day | First refresh of the morning |
| Morning | ~ 10:32 am race day | Final pre-race snapshot before off-time |
| BSP | After the race settles | Betfair Starting Price — the authoritative settled price |
Note: Opening odds aren't captured separately — Evening is the earliest baseline.
Sorting and reading the table
Click any column header to sort the table by that field. The default sort is Full Move ↓ so the biggest steamers of the day are at the top. Useful sort routines:
- Sort by Morning % descending to see the market's final order — effectively a "morning power rating" of public confidence.
- Sort by 1st Move to see overnight reactions — horses backed early when the smart money first sees the prices.
- Sort by 2nd Move on race day to see who's being supported in the closing window.
- On past races, sort by Race-day to see horses who moved sharply after the morning snapshot — often where late information (going changes, jockey switches) hit the market.
Tier and access
Market Movers is an Enterprise feature. Free and Basic tier users will see the tab but clicking it triggers the upgrade prompt. Enterprise, RaceMetrics Pro and Proform Premium (and admin) users get the full table on every race. All Market Movers columns are also available inside My Card for inclusion in a custom layout.