
Who can use it: Enterprise and above.
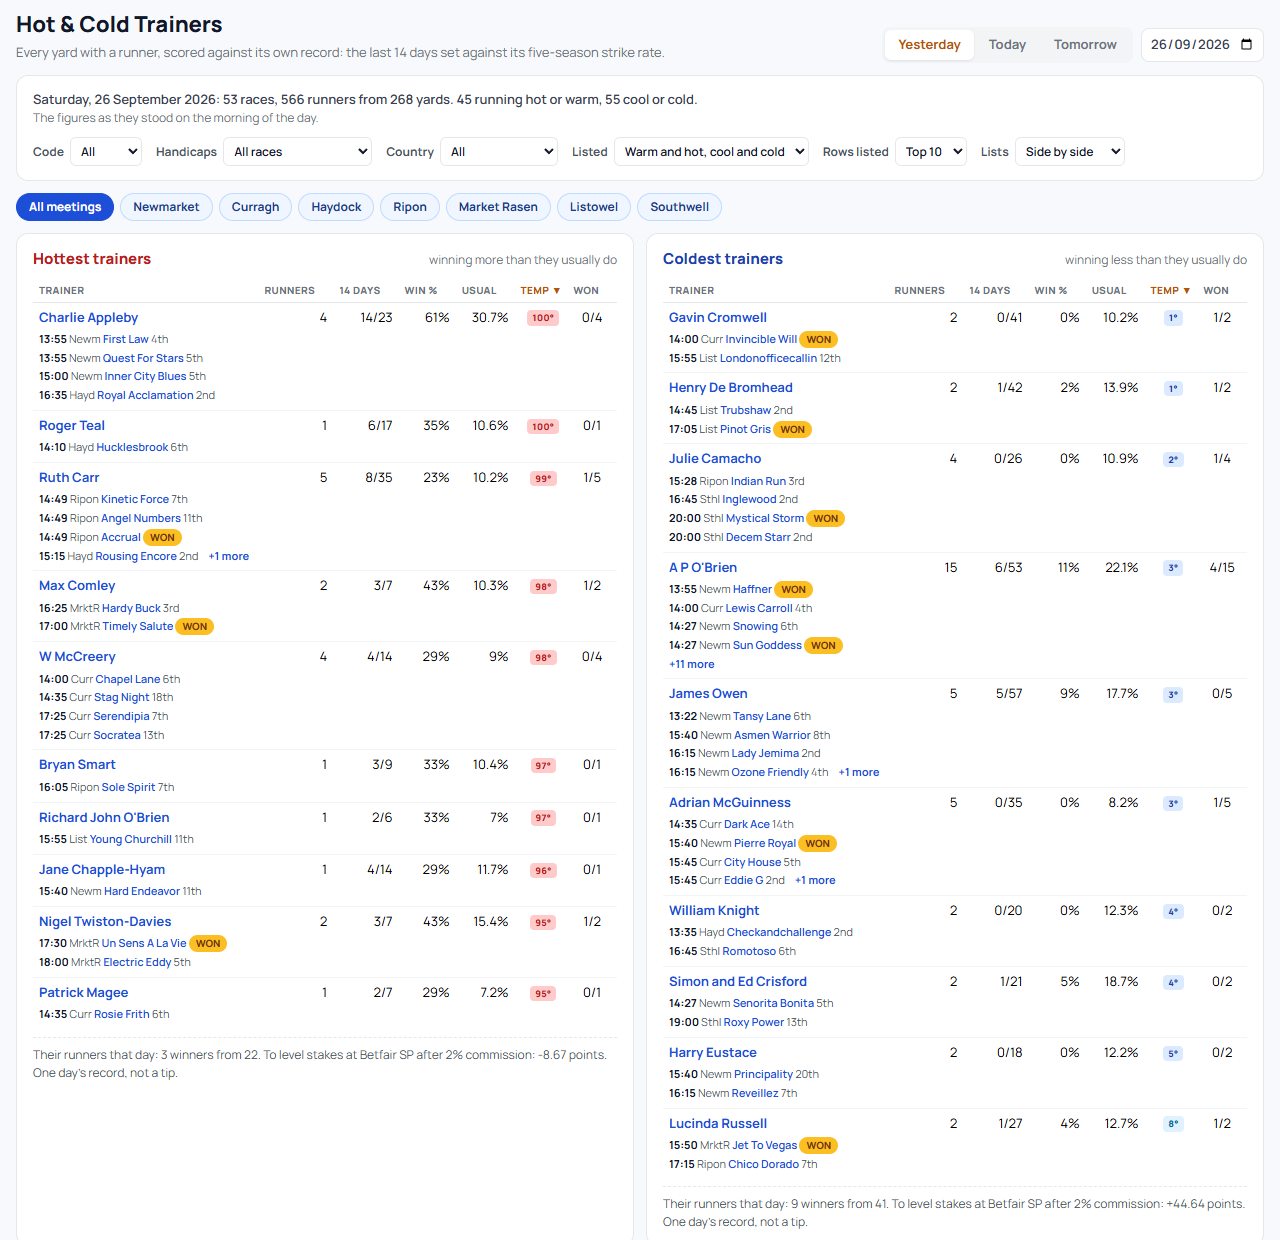
Hot & Cold Trainers (Racecards menu → Hot & Cold Trainers) puts every yard with a runner that day on one page: the trainers running hottest and coldest against their own record, the runners each of them has, and every race with each runner's yard temperature. It is laid out like Market Movers for the day, and every figure on it is the same Form Temperature you see in the pills on the racecard.
What is on the page
- Hottest trainers and coldest trainers — the yards whose last 14 days are furthest above, and furthest below, their own five-season strike rate. Each row shows how many runners the yard has that day, its record over the 14 days (wins from runs), its win percentage in that time, its usual strike rate and its temperature. Under each name are its runners: off time, course and horse. A yard with more than four runners shows the first four, and +3 more shows the rest.
- Listed — Warm and hot, cool and cold (the default) lists every yard scoring 75 or more, and 25 or less. Hot and cold only keeps the 95+ and the 5-or-under yards, the fortnights that come up by luck less than 1 time in 20.
- Rows listed chooses the top 10, the top 25 or every one; Lists puts the two side by side or one at a time, with a Hottest / Coldest switch.
- Meeting buttons — click a course to see only the yards with a runner there, and only their runners there. A yard with runners at two meetings appears under each, with that meeting's runners. Click a second course to put the two together (Perth and Fontwell, say, for the whole jumps picture), and All meetings to go back. Code set to Flat or Jumps does the same for every meeting of that code at once.
- Form over — Last 14 days (the default, the same as the racecard pills) or Last 28 days, which scores each yard the same way over four weeks for a steadier picture.
- Every race — each race opens to show its runners with their trainer's temperature, 14-day record, win percentage and usual strike rate. The race line says how many hot or warm, and cool or cold, yards it has.
- Yesterday, Today, Tomorrow and a date box for any day back to 2018. On a day that has been run, each runner shows where it finished, each yard shows its winners from its runners that day, and each list carries its runners' record with the return to level stakes at Betfair SP after 2% commission.
- Click a horse to open its racecard, or a trainer to open their profile.
How a yard is scored
Exactly as the racecard pills: the trainer's record over the 14 days before the racing day is set against their own five-season strike rate and turned into a score from 0 to 100 — how likely a fortnight this good, or this quiet, would be by luck alone. The window closes the evening before, so a yard's figure does not change during the day and is the same on every one of its races.
| Score | Reads as |
|---|---|
| 95 to 100 | Hot — a fortnight this good comes up by luck less than 1 time in 20 |
| 75 to 94 | Warm — a better fortnight than usual |
| 26 to 74 | Ordinary for this yard (shown in grey; the racecard shows no pill) |
| 6 to 25 | Cool — a quieter fortnight than usual |
| 0 to 5 | Cold — a fortnight this quiet comes up by luck less than 1 time in 20 |
Because each yard is judged against its own record, a small stable's two winners from six can rank alongside a big stable's fourteen from twenty-three. A yard needs at least 50 runs in five seasons and 3 in the fortnight to be scored; below that it is left out of the lists and shows a dash in the race tables. Tomorrow's figures take in today's results as they arrive.
Sorting and filters
Every column heading is clickable: once to sort, again to reverse. The two lists sort together, and in them Temp sorts on how unusual the fortnight is, so "most unusual first" puts the hottest first in one list and the coldest first in the other. Sorting only re-orders the trainers already listed. The race tables sort together too, where Yard runs from the hottest down to the coldest. Code (Flat or Jumps), Handicaps and Country (Great Britain, or Ireland including Northern Ireland) narrow the runners, and the yards are rebuilt from the runners that remain. Your choices are remembered on your device.
A lens, not a tip
A hot yard is statistically unusual, not a bet. Our own back-testing shows runners from hot yards do win more often than their usual strike rate suggests, but the market largely prices that in. Use the page to find the story — why is this yard flying, or quiet? — then look closer with the racecard, Form Expert or the System Builder. The record line on a past day is there so you can see how the runners went; one day's record is not a system.
Tier and access
Every signed-in member sees the day's three hottest and three coldest trainers. The full page — the full lists, each yard's runners, every meeting and race, and the results — is part of Enterprise, RaceMetrics Pro and Proform Premium, the same plans as Market Movers for the day.