
Profile pages provide comprehensive statistics and analysis for any participant. Access profiles by clicking names anywhere in the app.
Profile Header
Coloured stat cards at the top show key metrics:
- Rating: Current RaceMetrics rating (1500 average, 1550+ high, 1600+ elite)
- Runs: Total career runs
- Win %: Overall win strike rate
- P/L: Profit/loss to £1 level stakes at BSP
- Entries: Current upcoming entries (if any)
Lifetime record (horses): under the breeding and connections lines sits the horse's career split by discipline — a row each for Hurdle, Chase, NH Flat, Flat Turf and All-Weather (only the codes it has raced in) and an All runs total — with Runs, Wins, 2nds, 3rds, Winnings (prize money from its wins), Earnings (all prize money, first to eighth), OR (the official rating it carried on its latest run in that code), Best TS (best Proform speed figure) and, for RM Pro / Proform Premium members with a My Ratings set, Best My (the best figure your default set gave one of its runs). Above the table the full form figures run oldest to newest for jumps and for the Flat — Jumps form U063/331245780/2435P468/1F-9570 — with / between seasons and - before the current one, and letters for non-completions (F fell, U unseated, P pulled up, R refused, B brought down). It is built from the whole career and never changes with the page filters; opened from a racecard, the row for that race's discipline is highlighted. The same table appears in the Trad RC form pop-out.
Record (trainers, jockeys, owners, sires, dams and damsires): the same table, read the way a yard's record is read — Wins, Runs, %, Placed, Wnrs/Hrs (distinct winners over distinct horses), Winnings, Earnings, £1 BSP (profit or loss to £1 level stakes at Betfair SP after commission) and Best (the horse with the best Proform speed figure in that group, linked to its profile) — with Flat Turf and All-Weather each split into 2yo / 3yo / 4yo+ rows and an All runs total. Unlike the horse table it follows the filter bar: set Types to Flat and pick the years and you have a “Flat, last five seasons” record; the title names the filter in force. Trainers and jockeys carry a Form chip — the racecard's Form Temperature, wins from runs in the last 14 days against that yard's or rider's own five-year strike rate (hot, warm, cool, cold) — and jockeys their lowest riding weight in the last 12 months and the allowance claimed on their latest ride. Free to every member.
Form lines in a filtered view: break lines and first-time-change lines appear only on a horse's complete form (the runner's form on a racecard, the print page, the Trad RC pop-out). In any filtered view — a breakdown drill-down, a Form Expert category, a table of several horses — the gaps between rows are the filter, not a layoff, so those lines and their buttons are left out.
Breeding tab (horses)
The note a form student writes when first meeting a horse, drafted for you. The tab shows where the horse was bred, when it was foaled and its sire, dam and damsire, then every sibling (same dam) in one table: sex, foaled, where bred, sire, Flat runs–wins, Jumps runs–wins, best official rating (OR) on the Flat and over jumps, and current RaceMetrics rating — so “is this a Flat or a jumps family, and were any of them decent?” is answered without opening a single profile. Above the table sits a plain-English summary (“GB-bred, foaled 2024, by Caturra out of Dudley Queen. 3 siblings, 1 winner, all Flat. Best of them Poet's Dawn (OR 86, 16 wins)…”) with an Add to My Notes button that appends it to your General note for the horse (Enterprise and above), never overwriting what you have already written. Sale prices are not held.
Loading Large Profiles
For sires and other profiles with thousands of runs, the page loads in two stages:
- Quick Load: First 500 records load within seconds
- Background Load: Remaining history loads automatically
Stats update automatically when all data finishes loading.
Overview Tab
The main tab showing summary statistics, performance chart, and quick breakdowns.
Performance Summary shows: Wins, Places, Runs, Win Rate, Place Rate, Avg Field Size, and IV (Win) - the Impact Value showing how often this participant wins relative to expected.
P/L to £1 Stakes shows: Win P/L, ROI percentage, and Average Win BSP.
Chart - Use the dropdown to switch between:
- Rating History: Performance rating over time with overall average (dotted white) and moving average (dashed orange) lines to spot form trends
- P/L: Rolling profit/loss to £1 stakes at BSP with overall average line
- Win Rate: Rolling win percentage with overall win rate reference line
- PRB: Percentage of rivals beaten with 50% baseline (average performance) and overall PRB average lines
Dynamic Windows: Rolling calculations automatically adjust based on total runs - shorter windows for fewer runs, longer for more data. This ensures smooth trend lines regardless of sample size.
The chart automatically switches to P/L view when filters are active.
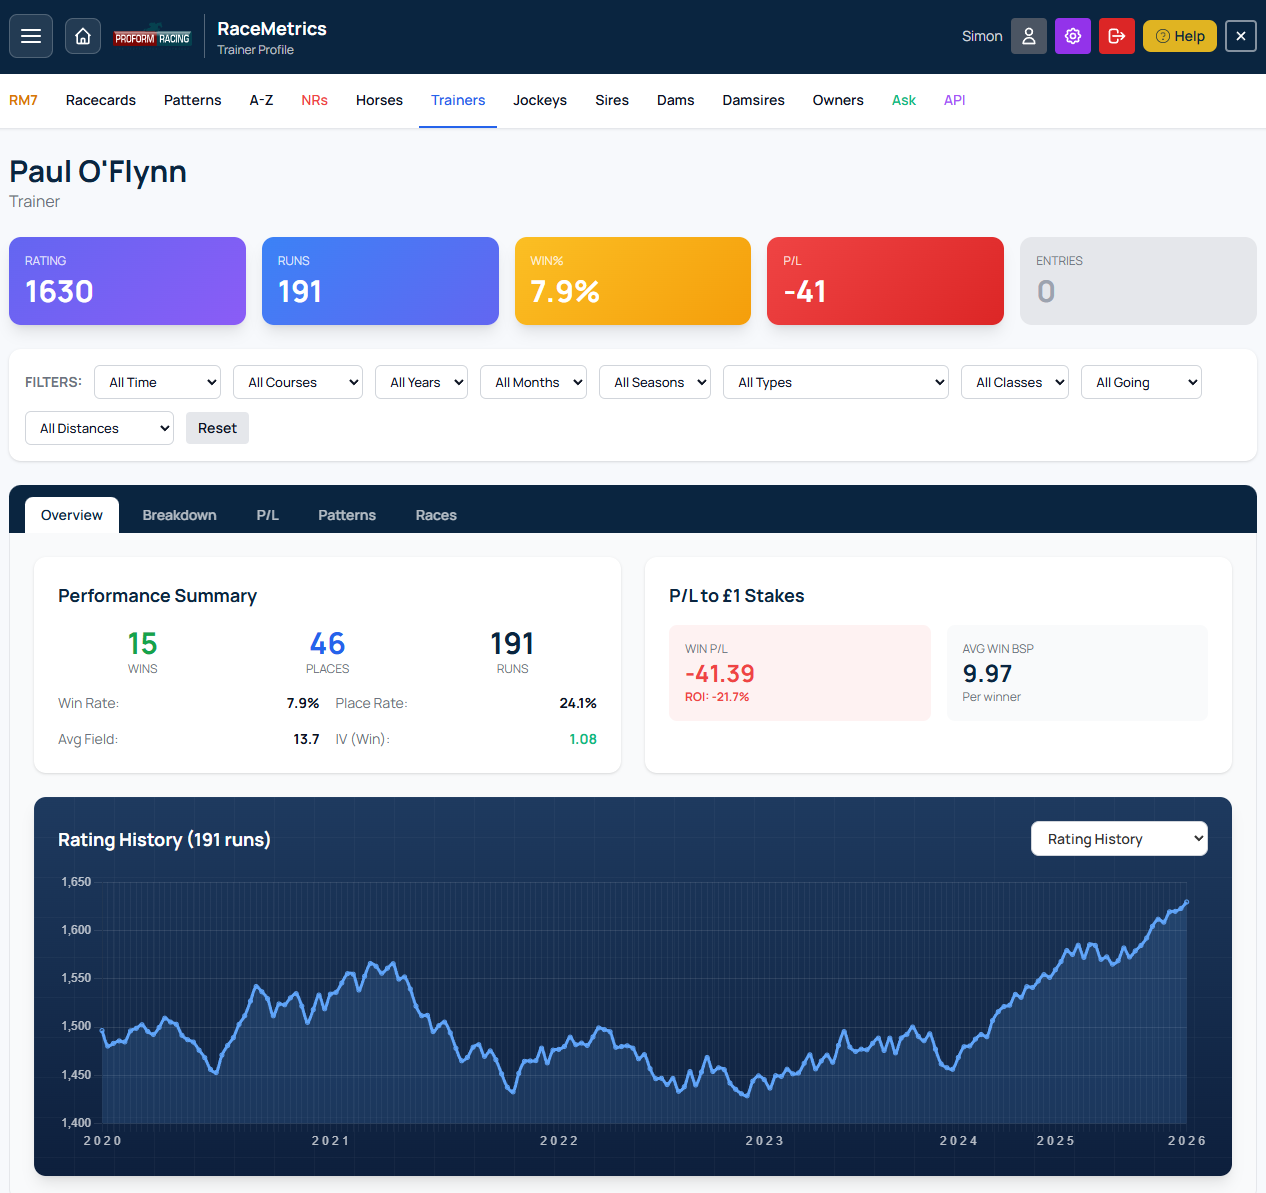
Profile page showing header stats, performance chart, and breakdown tables
Breakdown Tab
Detailed performance splits showing statistics across multiple categories. Each breakdown table shows:
- Name: The category value (horse name, course, class, etc.)
- Runs: Number of runs in that category
- Wins: Number of wins
- Win%: Strike rate percentage
- PRB: Percentage of rivals beaten average
- P/L: Profit/loss to £1 stakes at BSP
- ROI: Return on investment percentage
Available breakdowns:
- By Horse/Jockey/Owner: Performance with specific connections
- By Course: Track-by-track statistics
- By Class: Performance at each race class (1-6)
- By Official Rating (Flat / Jumps): Performance by the official rating carried at each run, in 10lb bands. Flat and jumps are shown separately because the two ratings are on different scales; unrated runs are left out
- By Race Type: Turf, Chase, Hurdle, NHF splits
- By Days Since Last Run: Freshness analysis
- By Distance: Performance over different trips
- By Favourite Status: When favourite vs outsider
- By Track Type, Direction and Gradient (course and trip): the record on Very Sharp to Stiff tracks, left-handed, right-handed or straight trips, and level, undulating, uphill or downhill ground, from Proform's course maps
- By Number of Bends, Distance to First Bend and Rise or Fall (Flat): straight trips against round ones, a short or long run to the first bend, and uphill or downhill finishes
- By Home Straight and Finish (jumps): short or long straights, and level to very uphill finishes
Use the Min Runs and Min Wins dropdowns to filter out small samples — a row must clear both to show. Click Show All to expand each table. Click any row to open the form-line drill-down (see below).
Match This Race
When you open a profile from a racecard, the rows that describe that particular race are highlighted for you — so you can read a trainer's record under today's exact conditions without flicking back to the card to check which rows apply.
Open a trainer from a Ripon Class 5 nursery, for example, and you will see Ripon lit up in By Course, Class 5 in By Class, both Nursery and Handicap in By Classification, the booked rider in By Jockey, and that horse's own age, official rating, days-since-last-run, draw, headgear and runs-in-the-last-three-months bands.
- Thirty breakdowns are covered — the race's own conditions (course, class, going, distance, field size, race type, surface, handicap, direction, classification, day, month, season, year) and the horse's own details.
- More than one runner in the race? Every applicable band is highlighted, not just one of them — a trainer with three runners genuinely spans three days-since-last-run bands.
- Nothing hides below the fold. If a matching row sits outside the ten a box shows by default, that box opens so the row stays visible in its true rank order.
- Upcoming races stay honest. Splits that only exist once a race has been run — favourite status, SP rank, price range, pace and actual going — are highlighted on past races only.
The highlighting is on by default. Use the Match this race button in the race bar at the top of the profile to turn it off; your choice is remembered.
Form-Line Drill-down Proform Premium
Two entry points on every profile open the same popup — the full inline form lines for whichever subset of runs you've drilled into. Same rich form-line view used on the racecard popup: SR, Pace, DR, Race, Dist, OffGng, Wgt, OR, MOR, Outcome, ISP, PRB, Jockey, Trainer. On non-horse profiles (trainer, jockey, owner, sire, dam, damsire) an extra Horse column sits before Date so you can tell which run was which — each name links to that horse's profile. Premium members on a sectionals plan also get the Sectionals toggle (ActGng, Race Pace bar, Style, Pos Track, +/-, Adj, MaxU, FS 2f / 1f / Fin, ROS, plus Stride and Cad where runs were tracked).
- Click the blue RUNS card at the top of the profile — the popup shows the latest 100 runs in the participant's full history (or in the currently-filtered subset if you've narrowed the page with the filters above).
- Click any breakdown row — the popup shows the runs that built that statistic. For example, a horse profile's “By Jockey: Ryan Moore” row shows every run this horse has had under Ryan Moore.
Both entry points use the same Click-to-Sort, persisted-sort, and Export-CSV behaviour described under Inline form lines — so whatever sort you've picked on the racecard popup is already in place when the drill-down opens, and the Export CSV button is unlocked because you needed Premium to get into the popup in the first place.
Large breakdowns are capped at the most recent 100 runs for performance — the popup header tells you when that cap has kicked in (e.g. “5,879 runs · 1,492 wins · PRB 64.4% · showing latest 100”). The cap keeps a typical Mullins-sized trainer drill-down rendering in well under a second; if you need more runs, narrow the page filters first and re-open.
The drill-down is gated to Proform Premium. Non-Premium accounts get an upgrade prompt instead of the popup — no fetch is made.
P/L Tab
Profit/Loss tracking based on £1 level stakes to Betfair SP. Shows cumulative P/L chart and breakdown by price range.
Patterns Tab
AI-detected profitable angles based on the current participant's history. The system automatically identifies:
Profitable Angles (green cards):
- Best Course: Most profitable track
- Best Season: Spring, Summer, Autumn, or Winter
- Best Class: Most successful race class
- Best Going: Preferred ground conditions
- Best Day: Day of week with best results
- Best Age: Age range (for horses via connections)
- Best DSLR: Optimal days since last run
- Best Price: Favourite, 2nd Fav, or Outsider
- Hot Jockey: Currently in-form jockey pairing
- When Favourite: Performance when market leader
Patterns to Avoid (red cards): Conditions showing negative ROI - courses, going, etc. where this participant struggles.
Click Quick Save or Save to Avoid to add patterns to your Pattern Manager for racecard alerts.
Races Tab
Complete race-by-race history. Shows 100 races at a time with Load More to fetch additional records.
Columns:
- Date: Race date
- Course: Track name
- Field: Number of runners
- Runners: Position and horse name (e.g., "1st Precious Man")
- Rating: RaceMetrics rating after this race
- Change: Rating points gained (green) or lost (red)
Click any row to open the full race result showing all runners with rating changes.
Race Results Popup
When you click a race from the Races tab, a detailed results view opens showing:
- Race header: Time, course, race name, distance, type, class, going, runners. When a horse was withdrawn after the bookmaker prices were taken, the header shows the Rule 4 deduction (pence in the pound) on a bet struck at the evening, breakfast or morning price, and it says when the race was a dead heat for first
- Full results table: All runners with finishing positions
- Rating changes: For each connection (H, T, J, S, D, DS, O) showing gains in green and losses in red
- Sectional Analysis: (Proform Premium + Sectionals Add On) Expandable section with full sectional data
Click any horse, trainer, jockey, or owner name to open their profile.
Filters
Apply filters to narrow down to specific conditions. Filters update all tabs and charts dynamically. Available filters:
- Time: All Time, Last 365 days, Last 180 days, etc.
- Courses: Filter to specific course(s)
- Years: Individual year selection
- Months: Specific month(s)
- Seasons: Spring, Summer, Autumn, Winter
- Types: Race type (Flat, NH Flat, Hurdle, Chase)
- Classes: Race class (1-7)
- Going: Ground conditions
- Distances: Distance range
- Handicap: Handicaps or non-handicaps
- Age: The horse's age at the time of each run (2yo to 7yo, 8yo+, and 3yo+ / 4yo+). On a trainer or sire page this shows, for example, the record with two-year-olds only. Saving the view as a pattern keeps the age
- Direction: Left or right-handed courses
Click Reset to clear all filters.
Saving Patterns
When you find a profitable angle, click "Save Current View as Pattern" to track it. Saved patterns appear as purple badge alerts on racecards when conditions match.
Recent Profiles Panel
Click the tab on the left side of the screen to open a slide-out panel showing your recently viewed profiles for quick navigation.
Colour coding by type:
- Horse - Blue
- Trainer - Green
- Jockey - Red
- Sire - Purple
- Dam - Cyan
- Owner - Orange
Closing the panel: Click the X button in the top corner, or simply click anywhere else in the app.