
Who can use it: RaceMetrics Pro and Proform Premium members with the Sectionals Add-On.
The Sectionals feature provides comprehensive race sectional data visualization, showing detailed timing, speed, and position data for each horse at every furlong marker throughout a race.
Access Requirements
- Requires a Proform Premium subscription plus the Sectionals Add On
- Access from the racecard page via the "Sectionals" button (appears for races with available data)
Sectionals Tabs Overview
Every tab’s table sorts. Click a column heading to sort the field by it, click again to reverse, and a third time to put the runners back in finishing order. That includes the furlong columns, so on the Position tab you can click 4f to see the order the field ran in at that point. Each horse keeps its own colour when you sort, so it still matches its line on the chart.
Sectionals includes 13 analysis tabs, each providing a different view of race performance:
1. Metrics Tab
A comprehensive overview combining upgrade analysis, acceleration times, speed, and stride data for each runner in one table. Green shading highlights the highest value in each column, red the lowest.
- Pos – Finishing position
- Dtw – Distance to winner (lengths)
- MaxU – Max upgrade from last 4f: how many pounds the horse could have improved by running the section more efficiently
- LbsAU – Pounds (lbs) behind winner after upgrade
- LenAU – Lengths behind winner after upgrade
- ChLen – Difference between actual lengths beaten and lengths after applying the upgrade
- PosAU – Theoretical finishing position after applying the upgrade
- ChPos – Difference between actual finishing position and theoretical finishing position
- TTR5–TTR30 – Time from out of the gate to reach 5, 10, 20, 25, and 30 mph (seconds)
- ROS – Late speed recorded 2 seconds after crossing the finishing line (mph)
- TS – Average top speed reached at any point in the race (mph)
- MINSL / ASL / MAXSL – Minimum, average, and maximum stride length (feet)
- MINSF / ASF / MAXSF – Minimum, average, and maximum stride frequency (strides per second)
All column headers are sortable – click to sort ascending, click again to reverse, and a third time to return to finishing order. Hover over any header for a description of the metric.
2. Times Tab
- Shows time (in seconds) for each furlong section
- Par times displayed in header row
- Supports speed unit conversion: Seconds, MPH, or KPH
- Color coding: Green = faster than par, Red = slower than par
- Interactive chart with each horse as a colored line
3. FSP% Tab (Finishing Speed Percentage)
- Shows each horse's speed from that section to the finish, as a percentage of its own average speed for the race — so 100% means that closing run matched the horse's own average (it is not the field average)
- Par for each section — the ground-adjusted benchmark for this race — is shown above each column, and it varies: typically near 100% early, then dropping into the high 90s by the finish as horses naturally slow
- Cells are colour-coded against that per-section par — green beats par, red falls short — so a horse can read below 100% yet still beat par at the line (a strong, sustained finish)
4. Position Tab
- Race position at each section (1st, 2nd, etc.)
- Lengths behind the leader displayed
- Cells color coded by time vs par (without showing time value)
- Chart with Y-axis inverted (1st at top)
5. Time Diff Tab
- Difference between horse's sectional time and par time
- Positive values = slower than par, Negative = faster
- Total column shows cumulative deviation
6. FSP% Diff Tab
- Difference between horse's FSP and par FSP
- Positive values = faster than par, Negative = slower
- Average column shows mean deviation
7. Cumulative Tab
- Running total of sectional times at each point
- Useful for comparing overall race time progression
8. Heat Map Tab
- Visual grid with color gradient showing performance intensity
- Green (fast) through yellow to red (slow)
- Click column headers to highlight that section across all tabs
- Horse and Pos sort like the other tabs; the furlong headings highlight rather than sort
9. Stride Tab
- ASL (Average Stride Length) in feet
- ASF (Average Stride Frequency) in strides/second
- Scatter plot: ASL (x-axis) vs ASF (y-axis)
- Field averages displayed below grid
10. Top Speed Tab
- Maximum speed achieved by each horse in mph
- Horses sorted by top speed (fastest first)
- Visual speed bars with rank highlighting (gold, silver, bronze)
11. FSP% Efficiency Tab
- FSP Efficiency Rank at each section
- Shows how efficiently each horse converted effort to speed
- Rank 1 = best efficiency at that section
- Color coded by rank (gold for 1st, green for top ranks)
12. Upgrades Tab
- Upgrade indicators at each section
- Flags potential rating improvements
- Total column shows count of upgrades across sections
13. Running Style Tab
Classification of racing style based on positional data:
- Held Up: Stays back most of race
- Mid-Division: Middle of the field
- Closer: Starts back, finishes strong
- Stalker: Mid-pack early, improves late
- Prominent: Near front but not leading
- Front Runner: Starts and stays near front
Includes position movement table showing Start/Mid/Finish positions with Gained/Lost column.
Controls
- Show Filter: All Runners, Top 3, Top 5, or Top 6 finishers
- Hide 1st Section: Excludes first section from charts (often skewed by starting stall behavior)
- Compare Mode: Select specific horses to compare directly
- Speed Unit: Toggle between Seconds, MPH, or KPH
Horse Color Dots
All tabs include colored dots next to horse names that match the chart line colors, making it easy to identify each horse's data in both the grid and chart views.
Section Highlighting
Click on any column header to highlight that section across all tabs, making it easy to compare performance at specific points in the race.
Predicted Running Styles (Racecards)
Available on the Racecard page (not race results), this feature predicts how each horse is likely to run based on their historical sectional position data. Found in the purple "Predicted Running Styles" accordion near the top of the racecard.
How It Works
- Analyzes up to the last 10 races with sectional data for each horse
- Uses decay weighting - recent runs carry more weight than older ones
- Calculates average positions in early and late stages of races
- Blends in the horse's Gate Speed Score – a 0–100 percentile of how fast it breaks from the stalls (measured times to reach 10mph over its last 5 tracked runs). Fast-gate horses lead early about twice as often, so measured gate speed sharpens the early-position evidence
- Classifies each horse into a predicted running style
Running Style Categories
- Front Runner: Typically leads from the start, racing in positions 1-3 early
- Prominent: Races near the front but not leading, positions 2-4
- Stalker: Tracks in mid-pack early, then moves up in the closing stages
- Mid-Division: Races in the middle of the field throughout
- Closer: Starts towards the back, finishes strongly, improving position late
- Held Up: Held at the back of the field, makes a late run
Table Columns Explained
- Style: The predicted running style with color-coded icon
- Gate: Gate Speed Score (0–100 percentile of stalls-break speed; red ≥ 80, amber ≥ 60; "–" when fewer than 2 measured runs)
- Runs: Number of historical races with sectional data used for the prediction
- Early Pos: Weighted average position in the first half of races (lower = closer to front)
- Late Pos: Weighted average position in the second half of races
Confidence Indicators
- 3+ runs: Normal confidence - reliable prediction
- 1-2 runs (⚠): Low confidence - treat with caution, shown with warning icon
- 0 runs: Insufficient data - no prediction available
Distance DNA & Full of Running
- Distance DNA: shown as a card on each horse's profile and as a colour-coded column in the racecard's Sectional Profile tab, comparing a horse's stride cadence to winning horses at the trips it has been running. Winners' cadence falls steadily as trips lengthen (≈2.39 strides/sec at 5–6f down to 2.15 at 2m+), so a horse galloping markedly slower than the winners at its trips profiles as built for further; quicker suggests sharper trips. Needs 3+ measured stride runs.
- Full of Running ("FoR LTO" badge): a beaten horse that recorded a top-2 run-out speed (measured 2 seconds after the line) and finished faster than par crossed the line with plenty left. These win about 16% next start vs a 10% baseline. The badge shows on racecard runner rows (and a chip on the profile) until the horse runs again, and a notification lists flagged horses on the morning they're declared.
- Both are part of the Sectionals toolset (Proform Premium + Sectionals Add-On).
What to Look For
- Pace Scenario: Multiple Front Runners suggest a fast early pace, which may favour Closers and Held Up horses
- Lack of Pace: No Front Runners may result in a slow pace, favouring those who race prominently
- Track Bias: Some courses favour front-runners (e.g., tight tracks), others suit closers (e.g., stiff finishes)
- Early vs Late Pos: Compare these values - horses improving late (lower Late Pos than Early Pos) may have more to give
- Lone Front Runner: A single Front Runner with no pace pressure often has an advantage
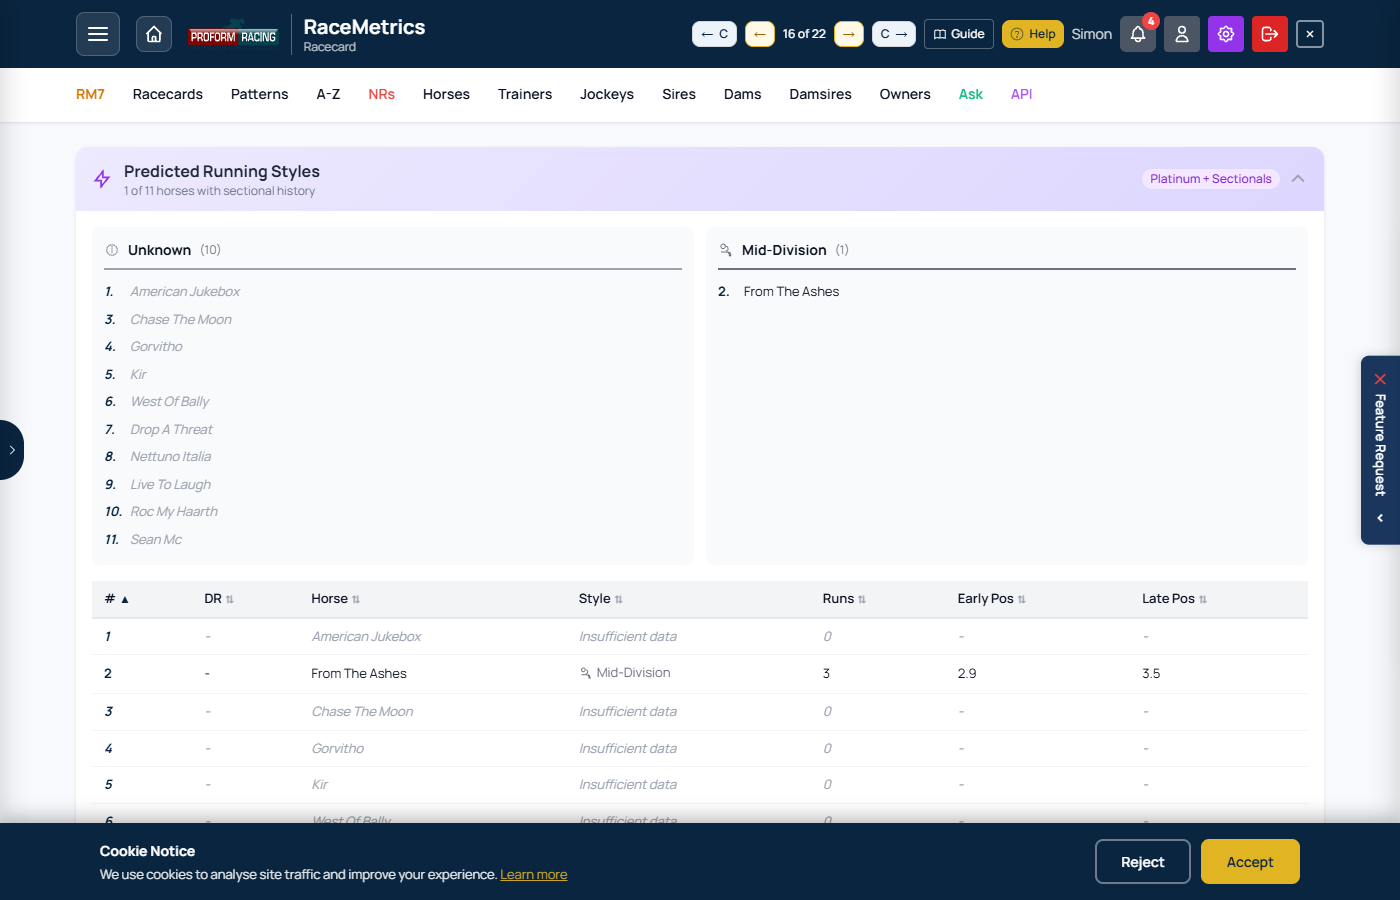
Predicted Running Styles panel showing pace predictions, early/late positions, and running style classifications for each runner
3D Pace Preview (Racecards)
Beside the Predicted Running Styles heading on every upcoming racecard is a gold ▶ 3D Pace Preview button. It opens a 3D animation of how the early part of the race is predicted to unfold: on the Flat the field breaks from the stalls in draw order, over jumps they set off from the tape, and over the first 15–20% of the trip each horse moves into its predicted early position. The picture then stops on the likely shape of the race: who leads, who has cover, and who will need the race to fall right.
What Drives the Prediction
- Predicted Running Styles – where each horse has raced early in its last 10 runs with sectional data, recent runs counting most
- Gate Speed Score – how quickly each horse has broken from the stalls in its recent tracked runs
- Pace profiles – each horse's Led / Prominent / Held Up record over its last 10 runs, recent runs counting most
- The draw – stall positions for the break (Flat races)
- The pace forecast – the likely tempo (strong / moderate / slow, from the number of likely leaders) sets how quickly the field strings out, with an allowance for the going
Using It
- Five cameras: Broadcast, Drone (with zoom), Finish Line, Onboard and Free
- Click a horse in the running order to follow it; the scrubber takes you to any point of the preview
- The running order shows the predicted positions and gaps forming as the field settles; the furlong boards count down from the full race distance
- Horses with no sectional history are placed in mid-division (they are marked as having too little data in the styles panel)
- Look for the stories the data tells: a lone front-runner crossing to an uncontested lead, two speed horses drawn wide apart converging, or a strong-pace race stringing out early
The preview is badged PACE PREVIEW: it is a prediction, not timing data, an illustration of the pace map and not a forecast of the result. The button shows on every racecard; watching it needs RaceMetrics Pro or Proform Premium with the Sectionals Add-On.