
Punchestown is a right-handed racecourse in Ireland. It has a Flat course and a jumps course.
Course facts
Chase course
| Direction | Right-handed |
|---|---|
| Character | Galloping and undulating |
| Course length | 1.86 miles (about 15 furlongs) |
| Home straight | 450 yards (about 2 furlongs) |
| Run-in from the last | 170 yards |
| Lowest point above sea level | 450ft |
| Highest point above sea level | 494ft |
| Winning post above sea level | 475ft |
| Notes | The chase course is outside the hurdles course. |
Hurdles course
| Direction | Right-handed |
|---|---|
| Character | Sharp |
| Course length | 1.48 miles (about 12 furlongs) |
| Home straight | 440 yards (about 2 furlongs) |
| Run-in from the last | 225 yards (about 1 furlong) |
| Lowest point above sea level | 452ft |
| Highest point above sea level | 472ft |
| Winning post above sea level | 472ft |
| Notes | The hurdles course is inside the chase course. |
Course map
Jumps course
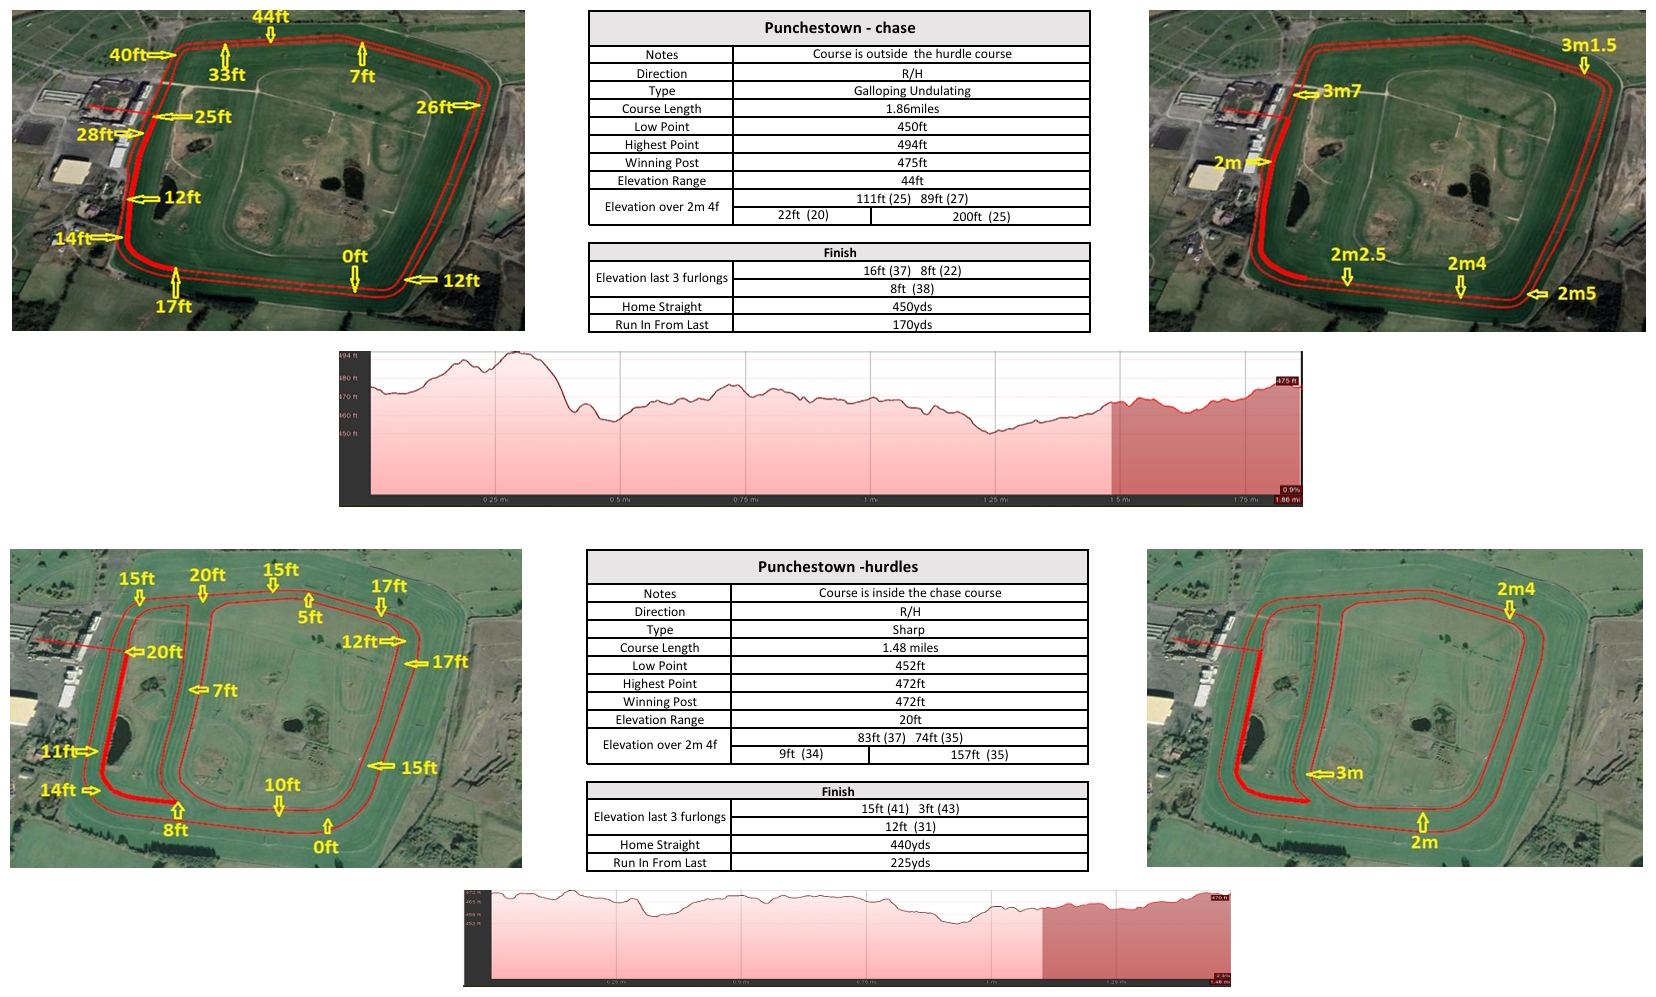
Course facts are taken from Proform's course maps. Heights are in feet above sea level.
Punchestown in figures
Racing here next: Monday 9 November
- 12:00 Matchbook Betting Exchange Handicap Chase (Class G) (0-100) 12 runners Racecard
- 12:30 Matchbook Betting Exchange Rated Novice Chase (Class E) 8 runners Racecard
- 13:00 Irish Stallion Farms EBF Fillies Academy Hurdle (Class E) 9 runners Racecard
- 13:30 Matchbook 50/50 Series 3-Y-O Maiden Hurdle (Class E) 10 runners Racecard
- 14:03 Matchbook 50/50 Series Maiden Hurdle (Class E) 11 runners Racecard
- 14:38 Matchbook Betting Exchange Handicap Hurdle (Class E) (0-115) 9 runners Racecard
- 15:13 Matchbook 50/50 Series Mares Maiden Hurdle (Class E) 11 runners Racecard
- 15:45 Matchbook Betting Exchange Handicap Hurdle (Class G) (0-100) 25 runners Racecard
The Flat trips
| Trip | Course | Direction | Track | Gradient | Bends | To the first bend | Start to finish |
|---|---|---|---|---|---|---|---|
| 7f | - | Left-handed | Sharp | Slightly Undulating | 2 | 291 yds | +7 ft |
| 1m | - | Left-handed | Sharp | Slightly Undulating | 2 | 511 yds | +4 ft |
| 1m 1f | - | Left-handed | Sharp | Slightly Undulating | 2 | 731 yds | -2 ft |
The jumps courses
| Course | Circuit | Direction | Track | Gradient | Home straight | Climb in the straight | Finish |
|---|---|---|---|---|---|---|---|
| Chase course | 2 miles | Right-handed | Galloping | Undulating | 476 yds | +11 ft | Uphill |
| Hurdle course | 1.56 miles | Right-handed | Sharp | Slightly Undulating | 476 yds | +6 ft | Slightly Uphill |
The draw
Where the winners were drawn in fields of 8 or more over the last 5 years: each figure is the share of the winners from that third of the stalls, with the share of the runners in brackets. A part of the draw winning well above or below its share is shaded, from 40 races.
| Trip | Races | Low draw | Middle | High draw |
|---|---|---|---|---|
| 1m 1f | 20 | 25% (36%) | 35% (34%) | 40% (29%) |
How the races are run
How the winners raced over the last 5 years: the share of the winners that led, raced prominently or were held up, with the share of the runners in brackets, shaded the same way.
| Trip or type | Races | Led | Prominent | Held up |
|---|---|---|---|---|
| 1m 1f | 25 | 4% (11%) | 56% (31%) | 40% (58%) |
| Chases, Chase course | 216 | 23% (12%) | 53% (39%) | 24% (49%) |
| Hurdles, Hurdle course | 464 | 23% (9%) | 51% (34%) | 26% (57%) |
| Bumpers, Hurdle course | 89 | 17% (9%) | 48% (36%) | 35% (55%) |
Course and trip measurements from the Proform course maps; results from Proform RaceMetrics.