
Leicester is a right-handed, galloping and undulating racecourse in England. It has a Flat course and a jumps course.
Course facts
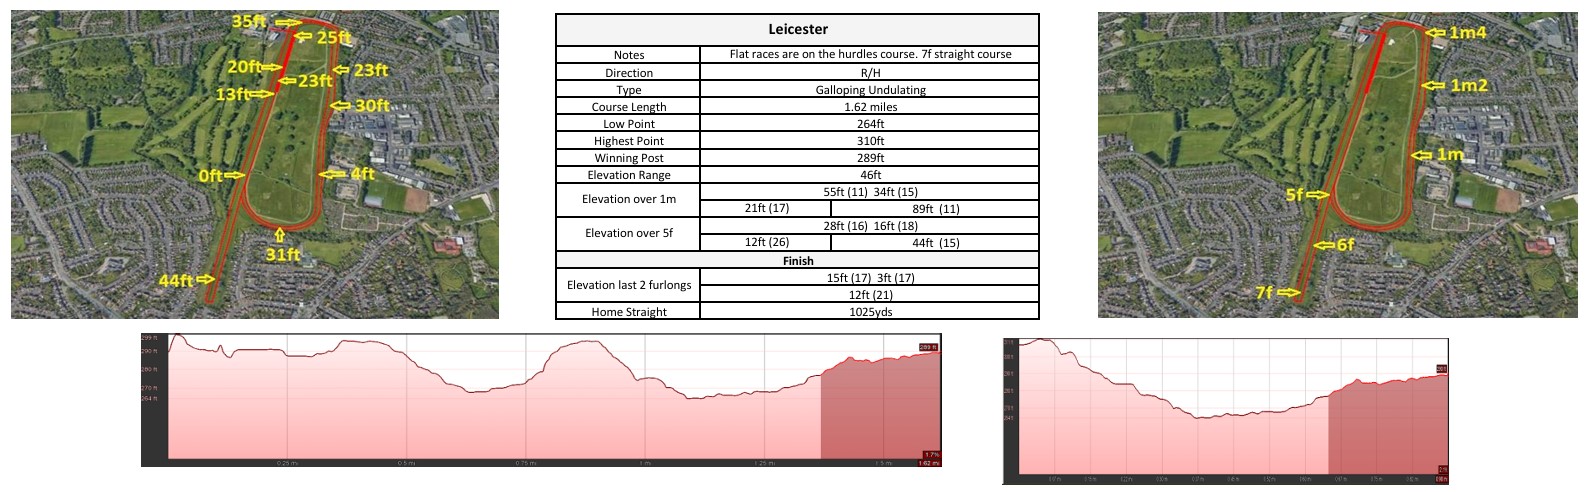
Flat course
| Direction | Right-handed |
|---|---|
| Character | Galloping and undulating |
| Course length | 1.62 miles (about 13 furlongs) |
| Home straight | 1,025 yards (about 4½ furlongs) |
| Lowest point above sea level | 264ft |
| Highest point above sea level | 310ft |
| Winning post above sea level | 289ft |
| Notes | Flat races are run on the hurdles course. There is a seven-furlong straight course. |
Jumps course
| Direction | Right-handed |
|---|---|
| Character | Galloping and undulating |
| Course length | 1.57 miles (about 12½ furlongs) |
| Home straight | 1,010 yards (about 4½ furlongs) |
| Run-in from the last | 280 yards (about 1½ furlongs) |
| Lowest point above sea level | 264ft |
| Highest point above sea level | 295ft |
| Winning post above sea level | 289ft |
| Notes | The chase course is on the outside in the home straight and on the inside in the back straight. |
Course maps
Flat course
Jumps course
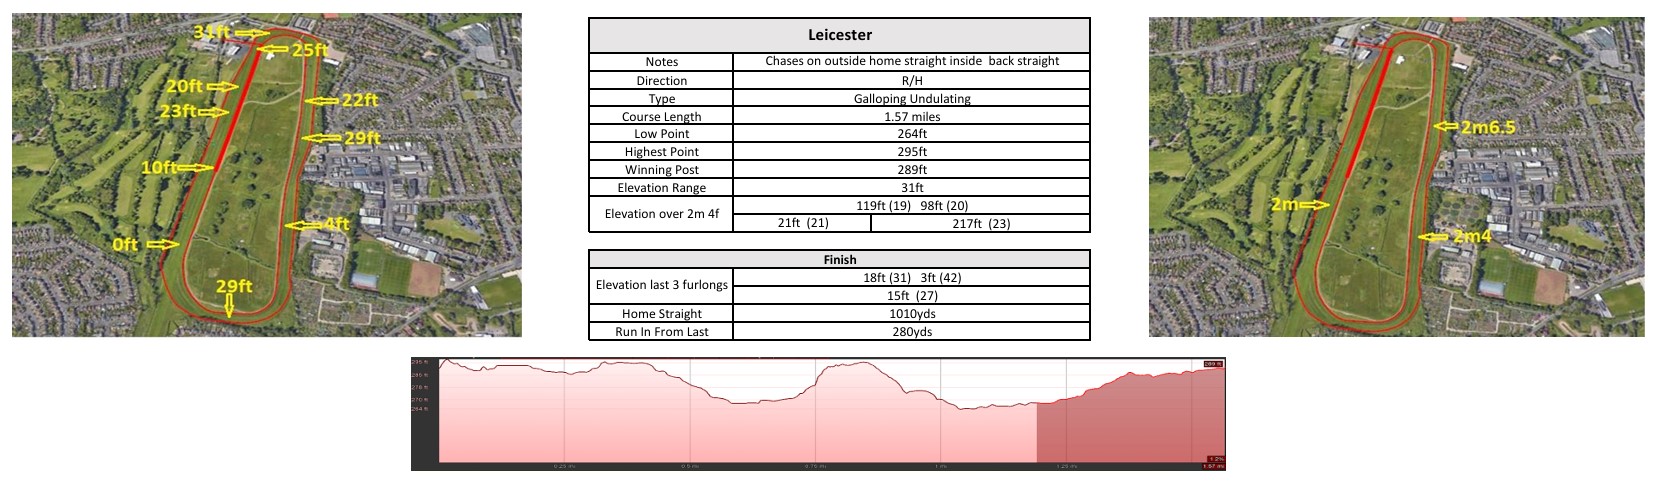
Course facts are taken from Proform's course maps. Heights are in feet above sea level.
Leicester in figures
Racing here next
No races are declared here yet.
The Flat trips
| Trip | Course | Direction | Track | Gradient | Bends | To the first bend | Start to finish |
|---|---|---|---|---|---|---|---|
| 5f | - | Straight | Galloping | Slightly Down & Uphill | 0 | Straight | +11 ft |
| 6f | - | Straight | Galloping | Slightly Down & Uphill | 0 | Straight | -4 ft |
| 7f | - | Straight | Galloping | Down & Uphill | 0 | Straight | -30 ft |
| 1m | - | Right-handed | Galloping | Slightly Undulating | 1 | 365 yds | +17 ft |
| 1m 2f | - | Right-handed | Galloping | Slightly Undulating | 1 | 752 yds | -6 ft |
| 1m 4f | - | Right-handed | Galloping | Slightly Undulating | 1 | 1,151 yds | +2 ft |
The jumps course
| Course | Circuit | Direction | Track | Gradient | Home straight | Climb in the straight | Finish |
|---|---|---|---|---|---|---|---|
| Jumps course | 1.57 miles | Right-handed | Galloping | Slightly Undulating | 1,003 yds | +17 ft | Uphill |
The draw
Where the winners were drawn in fields of 8 or more over the last 5 years: each figure is the share of the winners from that third of the stalls, with the share of the runners in brackets. A part of the draw winning well above or below its share is shaded, from 40 races.
Does it pay? The second line, shown from 40 races and 200 runners with a Betfair SP, is A/E and the return from backing every runner at Betfair SP after 2% commission. A/E is the winners divided by the winners their Betfair SPs expected. 1.00 means the market had it right. Above 1 they won more often than their prices said; below 1, less often. A bias that wins often but has an A/E near 1 is already in the price, so backing it blind does not pay. A few big-priced winners can swing one figure a long way: look for the same story across several trips.
| Trip | Races | Low draw | Middle | High draw |
|---|---|---|---|---|
| 5f | 33 | 42% (36%) | 36% (34%) | 21% (30%) |
| 6f | 88 | 42% (36%) A/E 0.97 · -17% | 31% (34%) A/E 0.93 · +101% | 27% (30%) A/E 1.13 · -25% |
| 7f | 109 | 39% (36%) A/E 0.94 · +15% | 32% (34%) A/E 0.91 · -11% | 29% (30%) A/E 1.25 · +28% |
| 1m | 53 | 36% (37%) | 34% (34%) | 30% (30%) |
| 1m 2f | 52 | 38% (37%) A/E 0.97 · -25% | 35% (33%) | 27% (30%) |
| 1m 4f | 25 | 32% (36%) | 32% (35%) | 36% (29%) |
How the races are run
How the winners raced over the last 5 years: the share of the winners that led, raced prominently or were held up, with the share of the runners in brackets, shaded the same way.
| Trip or type | Races | Led | Prominent | Held up |
|---|---|---|---|---|
| 5f | 65 | 32% (15%) | 52% (46%) | 15% (39%) |
| 6f | 134 | 22% (12%) | 53% (46%) | 25% (42%) |
| 7f | 172 | 26% (13%) | 48% (46%) | 26% (41%) |
| 1m | 78 | 24% (12%) | 46% (39%) | 29% (48%) |
| 1m 2f | 92 | 22% (12%) | 43% (40%) | 35% (48%) |
| 1m 4f | 71 | 31% (15%) | 39% (41%) | 30% (44%) |
| Chases | 144 | 30% (19%) | 47% (47%) | 23% (34%) |
| Hurdles | 119 | 28% (15%) | 43% (39%) | 29% (45%) |
Course and trip measurements from the Proform course maps; results and Betfair SPs from Proform RaceMetrics.