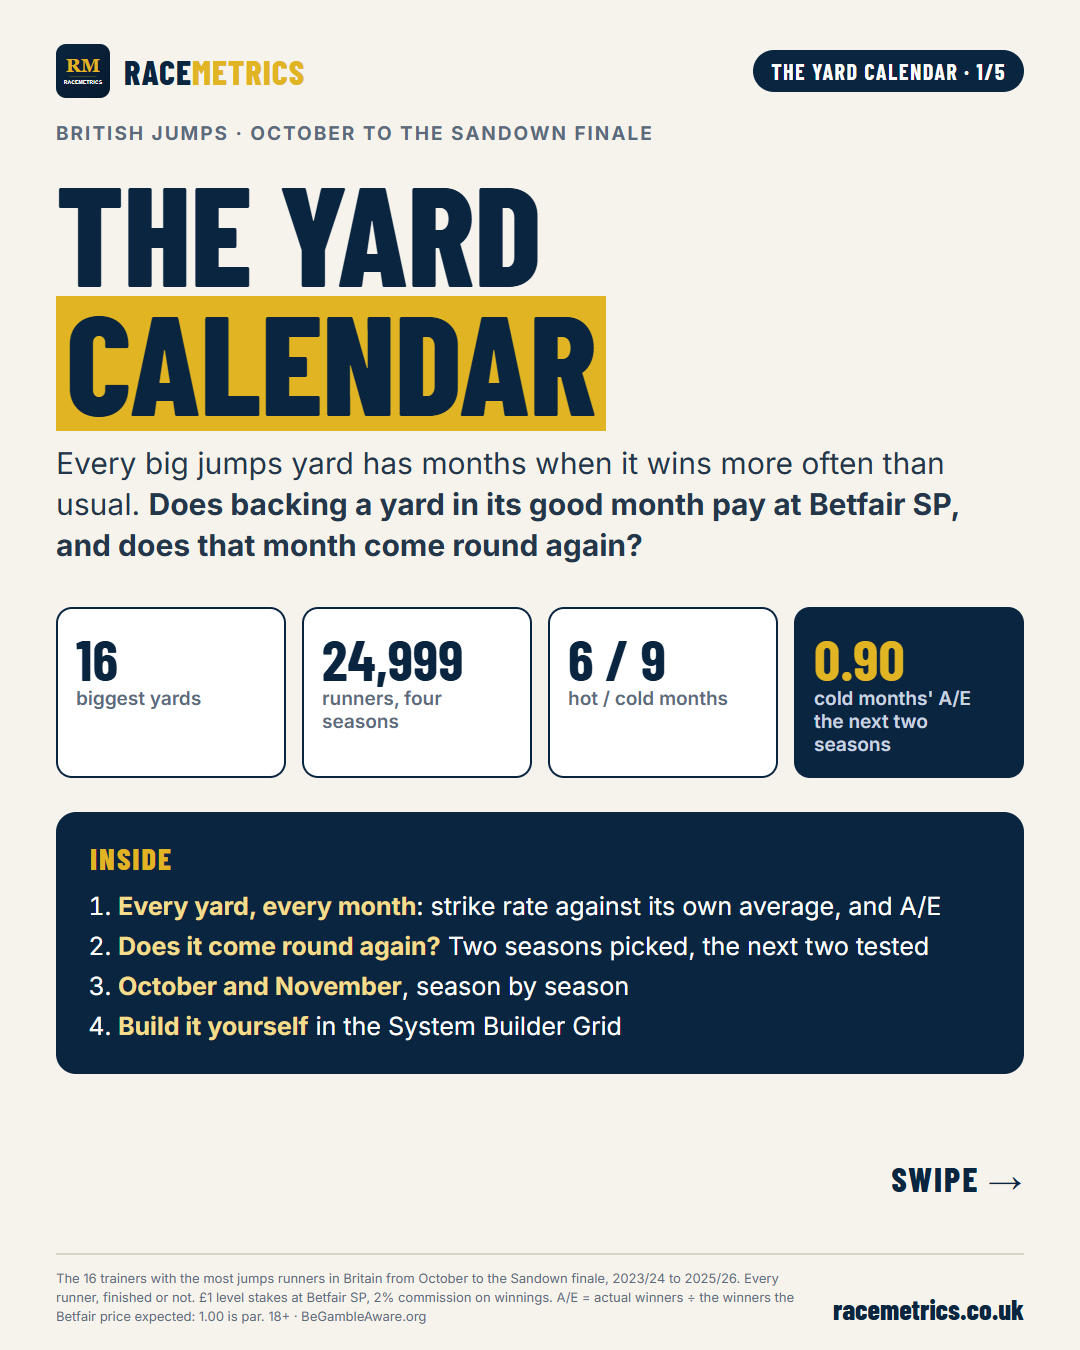
Every big jumps yard has months when it wins more often than usual, and lists of them go round every autumn. We took the 16 trainers with the most jumps runners in Britain, split four seasons into months from October to the Sandown finale, and asked the two questions those lists leave out: does backing a yard in its good month pay at Betfair SP, and does that month come round again?
THE SHORT VERSION
- The calendar is mostly priced in. Across all 18,804 runners from the 16 biggest British jumps yards over the last three seasons, every month's A/E at Betfair SP sits between 0.97 and 1.05.
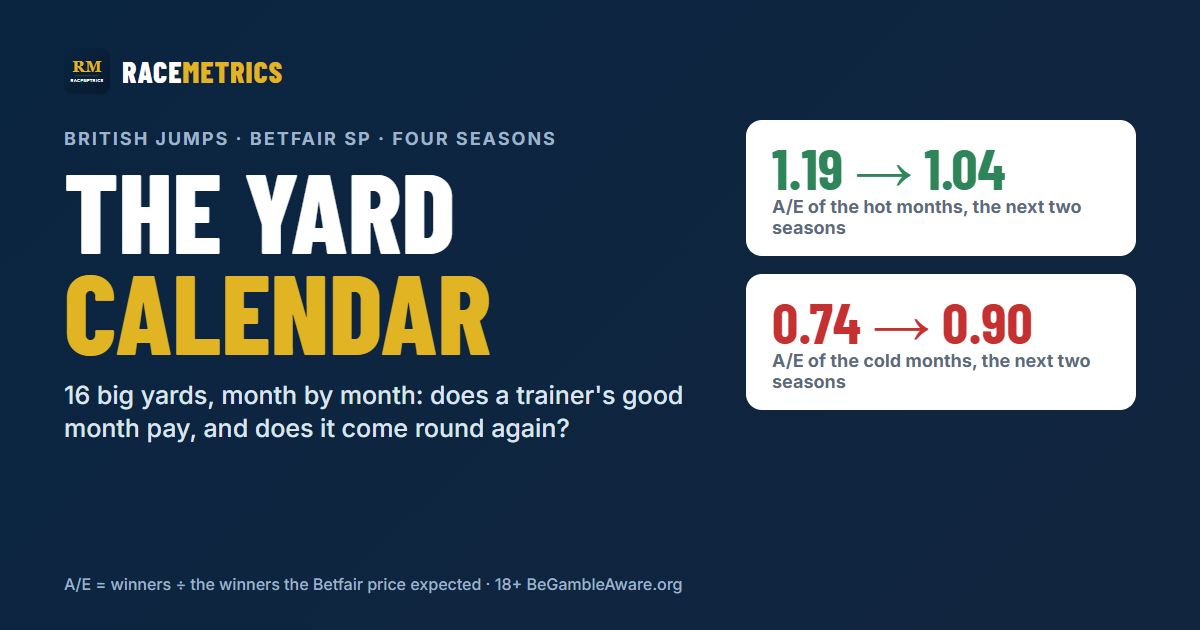
- Hot months fade. The nine yard-months that ran 5+ points above their yard's own average in 2022/23 and 2023/24 had an A/E of 1.19. In the next two seasons they still won more often than usual, but their A/E fell to 1.04.
- Cold months stay cold. The eight that ran 5+ points below average had an A/E of 0.74, and 0.90 in the next two seasons, losing 219.6 points at Betfair SP.
- Chance makes some of the pattern. Across 110 yard-months, chance alone would leave about 5 hot and 4 cold. We found 6 hot and 9 cold.
- October and November now: Neil Mulholland's November has been below par in all four seasons, Donald McCain's October in the last three, while Joe Tizzard's November has beaten the price three seasons running.
- Build it: System Builder, Race Type Chase, Hurdle and NHF, Course Country Great Britain, then the Grid with Trainer down the side and Month of Year across.
Every yard, every month
The grid below covers the last three seasons, 2023/24 to 2025/26: every runner from the 16 busiest British jumps yards between October and the Sandown finale, finished or not. Each square is that month's strike rate, coloured against the yard's own season, so a big yard and a small one are each measured against themselves. The small figure under it is A/E at Betfair SP: the winners the yard actually had, divided by the winners the Betfair price expected. 1.00 is par.
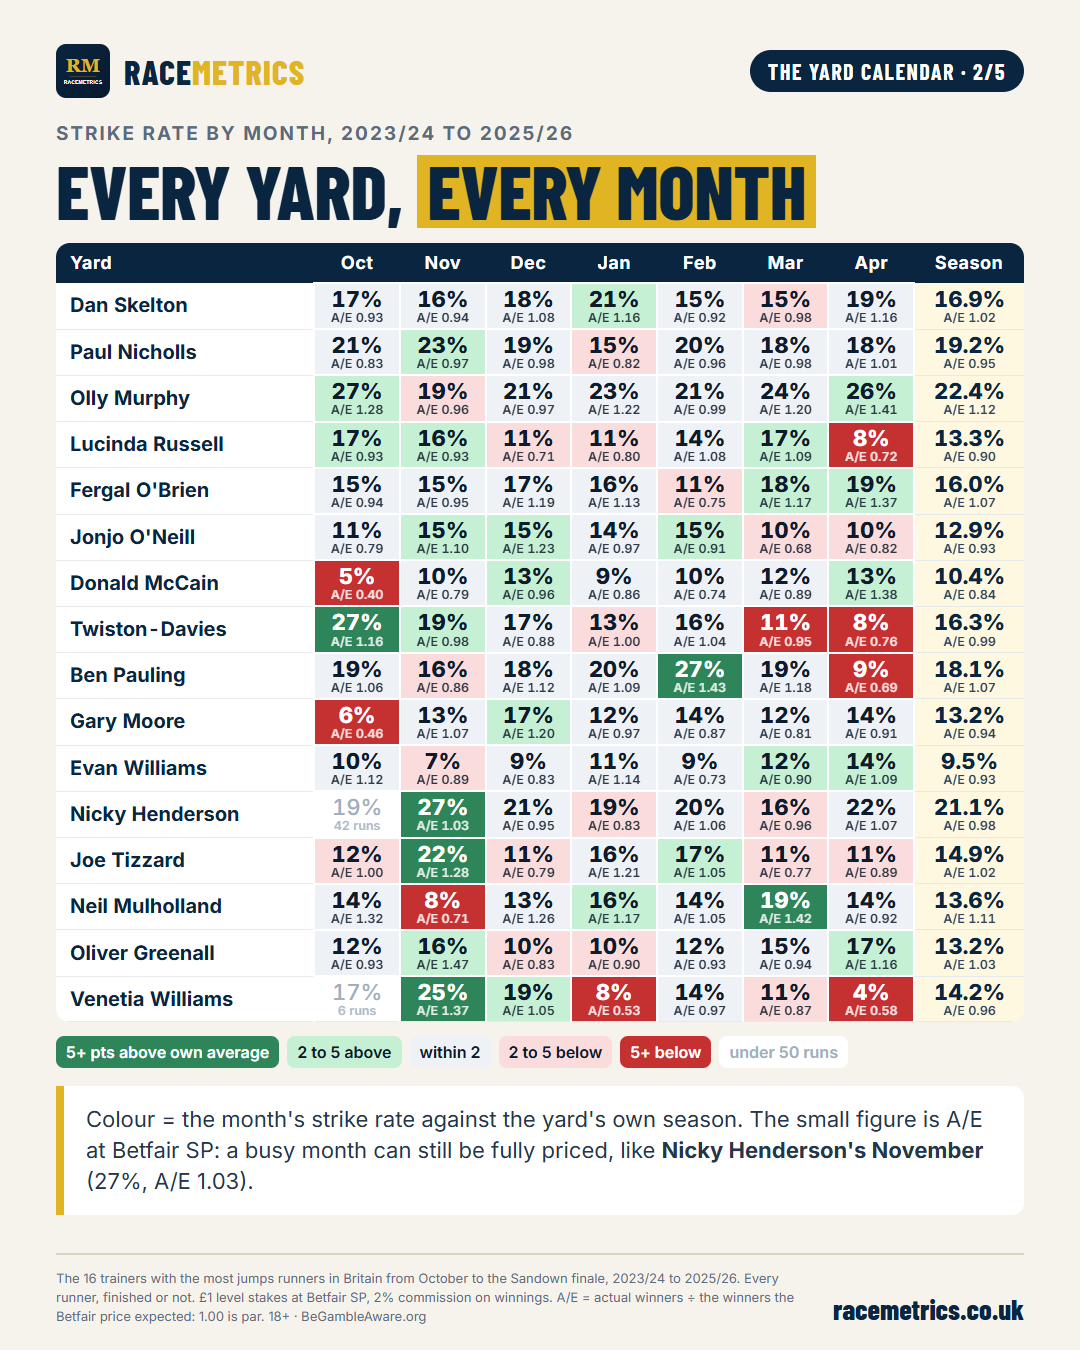
Some months stand out. Nigel Twiston-Davies has won with 47 of 175 October runners, 26.9% against 16.3% across his season. Venetia Williams has struck at 24.6% in November and 7.9% in January. Ben Pauling peaks in February at 26.6%.
The small figure tells the other half of the story. Nicky Henderson's November is one of the hottest months on the grid at 26.5%, and its A/E is 1.03: the market knows. Add all sixteen yards together and every month comes out between 0.97 and 1.05. Strike rate tells you when a yard wins. A/E tells you whether the price already allows for it.
Does it come round again?
A pattern you can bookmark has to repeat. So we picked the hot and cold months from the first two seasons, 2022/23 and 2023/24, and looked at how the same yard-months did in the next two.
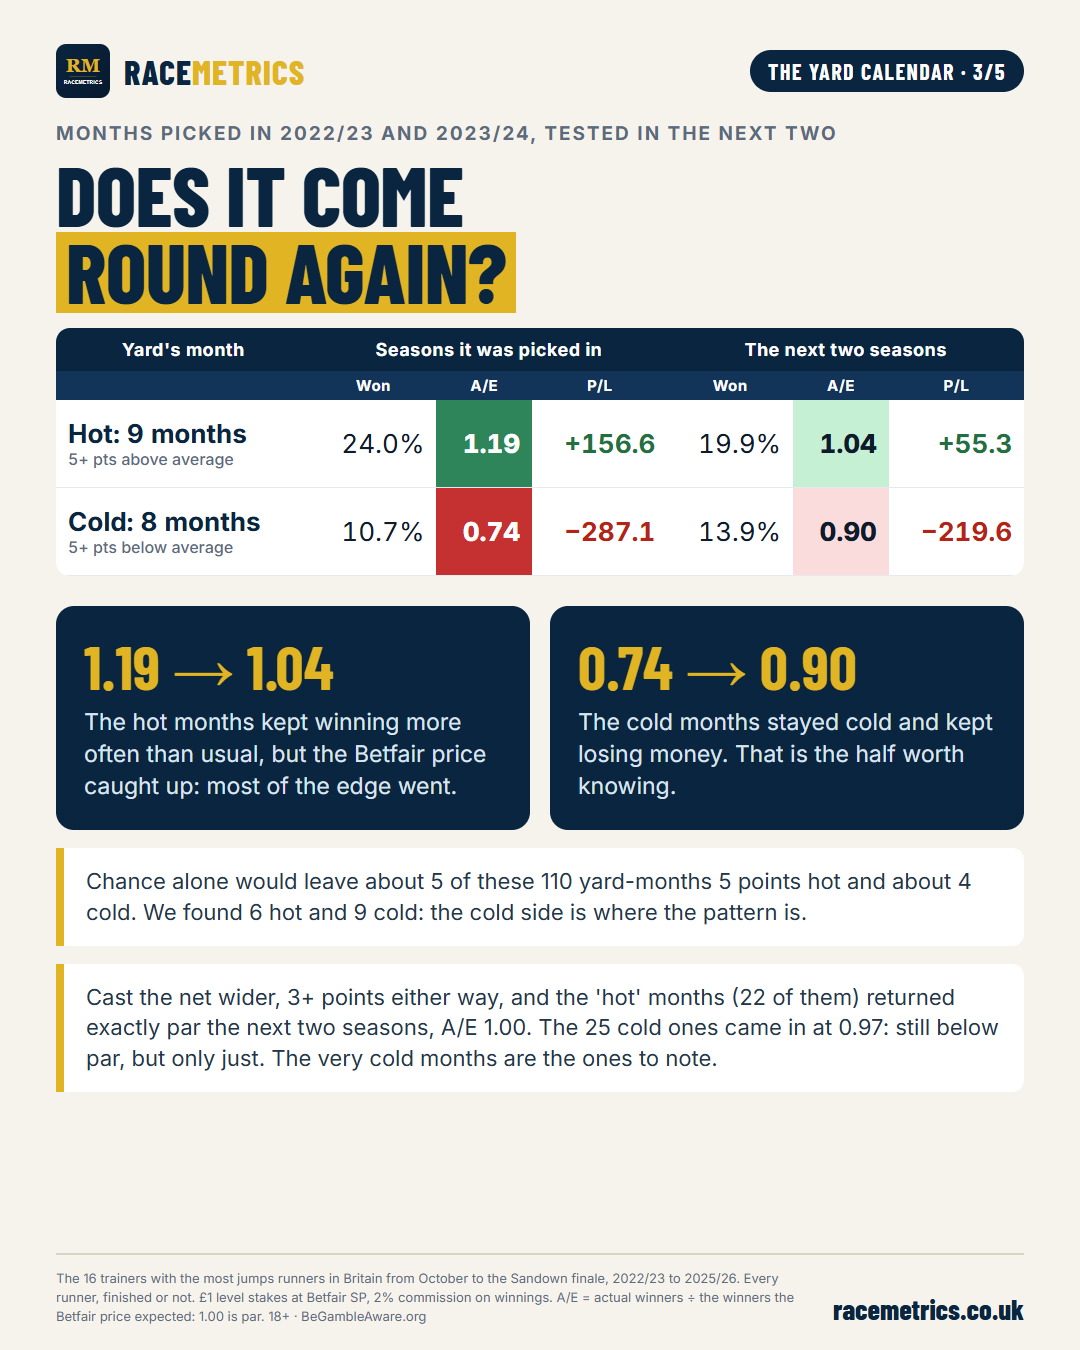
- Hot (5+ points above the yard's average), 9 months: 24.0% winners and A/E 1.19 when picked; 19.9% and A/E 1.04 in the next two seasons.
- Cold (5+ points below), 8 months: 10.7% and A/E 0.74 when picked; 13.9% and A/E 0.90 in the next two seasons, still losing 219.6 points at Betfair SP.
Cast the net wider, 3 points either way, and the 22 hot months returned exactly par the next time round (A/E 1.00), while the 25 cold ones came in at 0.97. The hot side of a yard's calendar keeps showing up in the strike rate, but the price follows it. The very cold months are the part worth knowing, and mostly as months to leave a yard alone.
It is also worth asking how much of any calendar is luck. With 110 yard-months, most of them built from 100 to 400 runners, chance alone would leave about 5 of them 5 points above their yard's average and about 4 below. We found 6 above and 9 below. Seven yard-months beat their yard's average in all four seasons, which is about what chance would give; twelve were below it in all four, roughly twice what chance would give.
October and November, season by season
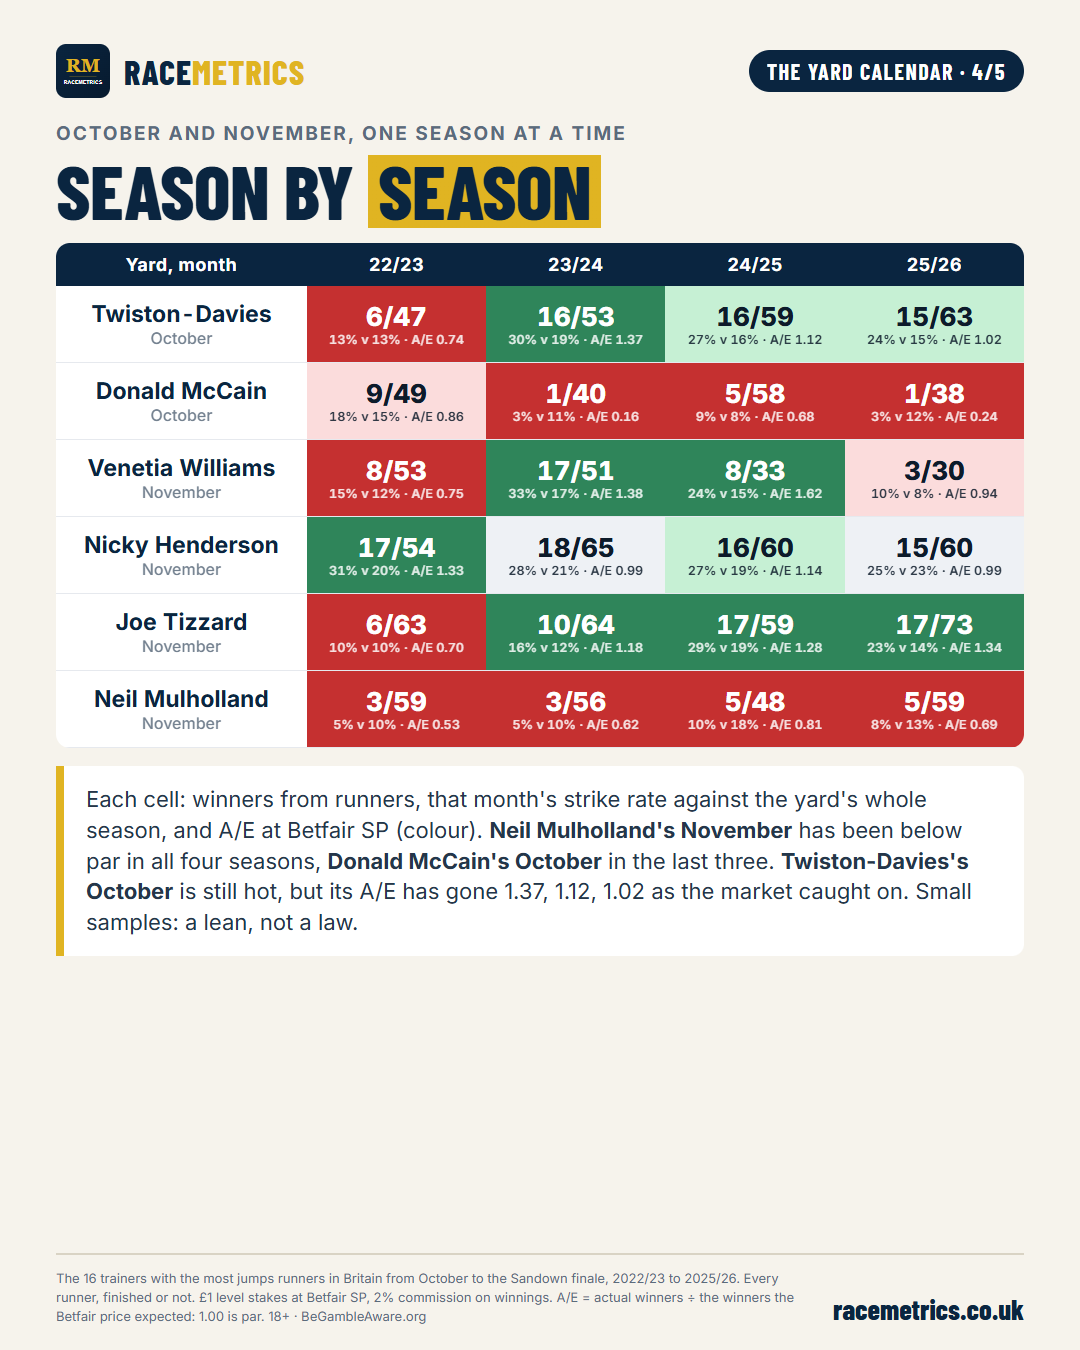
- Nigel Twiston-Davies, October: hot in each of the last three seasons, but the A/E has gone 1.37, 1.12, 1.02 as the market has caught on.
- Donald McCain, October: 1 from 40, 5 from 58 and 1 from 38 over the last three seasons, A/E 0.16, 0.68 and 0.24.
- Neil Mulholland, November: below par in all four seasons, A/E between 0.53 and 0.81.
- Joe Tizzard, November: A/E 1.18, 1.28 and 1.34 in the last three seasons, the one hot month on this slide that has kept beating its price.
- Venetia Williams, November: 17 from 51 and 8 from 33 in the middle two seasons, then 3 from 30 last season.
Thirty to seventy runners a month is a small sample, so read each row as a lean, not a law. A yard's October can also simply reflect which horses are ready early, which changes from one season to the next.
Build your own calendar

In the System Builder (RaceMetrics Pro and Proform Premium), set Race Type to Chase, Hurdle and NHF and Course Country to Great Britain. Open the Grid, put Trainer down the side and Month of Year across the top, and switch the figure between strike rate, A/E at Betfair SP and P/L. Set a minimum number of runs so the small yards do not fill the screen. The System Builder's history starts in 2018.
For a yard's form right now, rather than its usual month, Hot & Cold Trainers scores every yard with a runner today. And for which yards beat the Betfair price over the whole of last season, see Trainer forensics: which jumps yards beat the Betfair price in 2025/26?
How we measured it
- Yards: the 16 trainers with the most jumps runners in Britain from October to the Sandown finale over 2023/24 to 2025/26, under the trainer name on the racecard.
- Runners: every chase, hurdle and bumper runner at British courses, finished or not, from 1 October to the last day of the Sandown finale meeting, 2022/23 to 2025/26: 24,999 runners. The grid uses the last three seasons, 18,804 runners.
- Hot and cold: a month's strike rate against the yard's own strike rate over the same seasons. A month needs 50 runners to be coloured in the grid, and 30 in each half for the repeat test.
- Prices: £1 level stakes at Betfair SP, 2% commission on winnings. A/E = actual winners ÷ the sum of 1/(Betfair SP + 1) over the runners: 1.00 means the price was right.
- Chance: the "chance alone" figures come from simulating every yard-month 2,000 times at the yard's own strike rate.
Past figures describe what happened; they are a lens on the market, not a promise of profit. 18+ BeGambleAware.org