
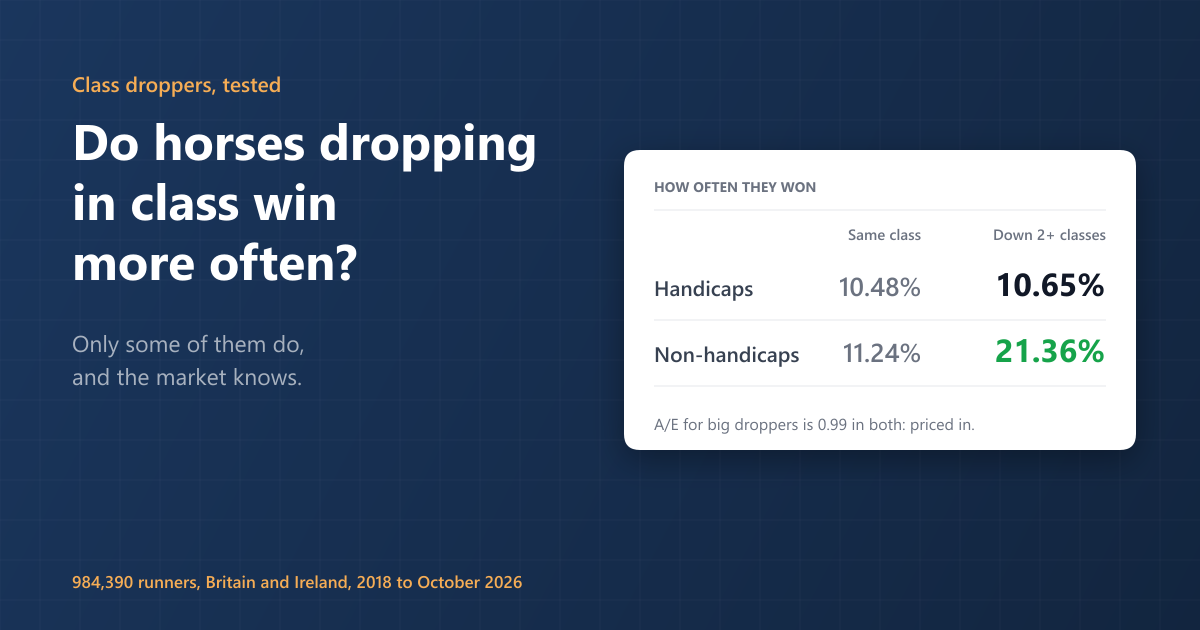
Only some of them do. Horses dropping two or more classes won 14.91% of their races against 10.73% for horses staying in the same class, but almost all of that gap comes from non-handicaps. In handicaps the figures are 10.65% and 10.48%, and a one-class drop wins less often than no drop at all. The drop does help a beaten horse once you compare like with like, and the market has priced that in.
“Always take a good look at the horse’s profile when it drops in class, because it may be regressing. A horse coming down from a good race is a very different proposition from one that has simply been losing its form.”
Simon Walton, RaceMetrics founder
These figures cover 984,390 runners in Britain and Ireland, from January 2018 to the end of October 2026, Flat and jumps. Every one had run before, so we could compare today's class number with the class of its last race.
How to read the numbers. A/E stands for actual over expected. It compares a group's winners with the number its Betfair SP prices implied, so 1.00 means the group won exactly as often as the market said it would. A strike rate tells you how often something wins. A/E tells you whether you were paid properly for it.
The headline number looks like a clear yes
| Compared with its last run | Runners | Won | A/E |
|---|---|---|---|
| Up 2+ classes | 52,934 | 9.34% | 1.02 |
| Up 1 class | 152,211 | 10.39% | 1.00 |
| Same class | 563,939 | 10.73% | 1.00 |
| Down 1 class | 167,341 | 10.69% | 1.00 |
| Down 2+ classes | 47,965 | 14.91% | 0.99 |
Pool everything together and the old belief holds up for a big drop. Even here, though, a one-class drop does nothing: 10.69% against 10.73% for staying put. And the A/E column barely moves, from 0.99 to 1.02, whichever way the horse is going.
Split out the handicaps and most of the effect goes
| Compared with its last run | Handicaps: won | A/E | Non-handicaps: won | A/E |
|---|---|---|---|---|
| Up 2+ classes | 9.27% | 1.03 | 9.42% | 1.00 |
| Up 1 class | 10.69% | 1.00 | 9.64% | 1.01 |
| Same class | 10.48% | 1.00 | 11.24% | 1.00 |
| Down 1 class | 9.95% | 1.00 | 13.59% | 1.00 |
| Down 2+ classes | 10.65% | 0.99 | 21.36% | 0.99 |
In non-handicaps, a big drop nearly doubles the strike rate. In handicaps it adds less than a fifth of a percentage point. The one-class row is odder still: handicappers going up a class (10.69%) win more often than those coming down a class (9.95%).
That is not a quirk of the Irish figures. In British handicaps alone the order is the same: up one class 11.51%, same class 11.18%, down one class 10.77%. A drop of two or more wins 11.67%. Size makes little difference either: exactly two classes wins 10.55% and three or more 11.11%.
Why handicap droppers look so ordinary
Horses are not moved between classes at random. Trainers step a horse up after it has run well and bring it down after it has run badly. So the groups are full of different horses before the race even starts.
| Group in handicaps | Won last time | Won today |
|---|---|---|
| Up 1 class | 22.4% | 10.69% |
| Same class | 9.7% | 10.48% |
| Down 1 class | 3.8% | 9.95% |
| Down 2+ classes | 2.1% | 10.65% |
More than one in five horses going up a class won last time. Only about one in fifty of the big droppers did: 87% of them finished fourth or worse, or did not finish. The comparison in the headline is really between horses in form and horses out of it.
So compare horses that finished in the same place last time.
| Last run | Up 1 | Same class | Down 1 | Down 2+ |
|---|---|---|---|---|
| Won | 16.84% | 19.24% | 19.21% | 18.42% |
| 2nd | 14.05% | 15.76% | 16.22% | 17.88% |
| 3rd | 11.22% | 13.22% | 14.33% | 14.98% |
| 4th to 9th | 7.63% | 8.64% | 9.28% | 10.52% |
| 10th or worse | 4.17% | 5.21% | 6.22% | 8.31% |
| Did not finish | 7.19% | 7.02% | 6.42% | 8.63% |
Now the drop shows up. Take a handicapper that finished fourth to ninth last time. It wins 8.64% of the time in the same class and 10.52% if it drops two or more, about 22% more often. For a horse that finished tenth or worse, the rise is from 5.21% to 8.31%, about 60%. Read across any of the four middle rows and the strike rate climbs with each step down.
Horses that won last time are the exception: a big drop does nothing for them, at 18.42% against 19.24%, though only 608 winners made that move in almost nine years. Horses that did not finish last time show no clear pattern, which makes sense: a fall or a pulled-up tells you much less about ability than a finishing position.
In non-handicaps, it is about who is dropping
| Last run | Same class | Down 2+ |
|---|---|---|
| Won | 27.15% | 36.45% |
| 2nd | 24.20% | 37.96% |
| 3rd | 16.49% | 29.29% |
| 4th to 9th | 7.52% | 19.58% |
| 10th or worse | 2.48% | 15.17% |
| Did not finish | 6.00% | 17.41% |
A non-handicap dropper is usually a different animal. Of these 19,107 runners, 44% last ran in a Class 1 race and 78% in Class 1 or 2. Novice and maiden races are the most common places they turn up next. A horse beaten out of sight in good company and then turned out against modest opposition is not comparable with one that was beaten out of sight in a Class 5, which is why 10th-or-worse last time wins 15.17% in one group and 2.48% in the other.
The market sees it straight away. In non-handicaps, 24% of these droppers were sent off shorter than 2/1 at Betfair SP, and they supplied 57% of the group's winners. In handicaps it was under 4%.
None of it beats the price
Backing every big dropper in a handicap to level stakes at Betfair SP, after 2% commission, loses 0.06% across the whole period. At industry SP it loses 20.87%. That break-even-at-best result, an A/E of 0.99, is what you would expect from a fact everyone can read off a racecard.
The year-by-year figures show how easy it is to fool yourself. The same handicap group returned -14.9%, -18.6% and -14.1% in 2018 to 2020, then +20.5% and +26.5% in 2023 and 2024. Anyone testing only those two years would think they had found a system. Of the 1,649 points of profit in those two years, 1,163 came from 33 winners at 33/1 or longer. In 2026 to date it is back to -6.9%. Over the two halves of the period the A/E goes from 0.95 (2018 to 2022) to 1.03 (2023 to 2026). They point in opposite directions, so neither is one to lean on.
The non-handicap group is steadier, between 0.95 and 1.02 every year, and never meaningfully above par.
One small thing to keep an eye on is the opposite move. Handicappers stepping up two or more classes have the highest A/E in the table, 1.03 on 27,497 runners. It has faded from 1.05 to 1.02 between the two halves of the period and the sample does not clear the bar for a real finding, so this is a thread rather than a bet.
What this does not show
It does not prove that dropping in class causes a horse to run better. Going by last-run finish removes only part of the difference between these groups. A trainer who drops a horse may also have changed its trip, its ground or its headgear, or simply waited until it was ready. We also compare class numbers only, so a horse can drop in class while running off the same mark, and some moves cross from one code to another.
How to use it
- In a handicap, do not count a class drop as a plus on its own. Ask how the horse ran last time, and compare it with other horses that ran as badly.
- In a non-handicap, look at where it has come from. The strength of the race it has left matters more than the fact it has moved.
- Do not expect the drop to pay. It helps you work out why a horse is the price it is. It is not a reason to back it.
You can run all of this yourself in the System Builder: add the Class Move vs LTO rule, then break it down by LTO Position and Handicap. Try it on your own favourite angle too, and look at the A/E column before the strike rate.
Questions we get asked about this
Do horses dropping in class win more often?
A drop of two or more classes wins 14.91% against 10.73% for staying in the same class, but most of that comes from non-handicaps (21.36% against 11.24%). In handicaps it is 10.65% against 10.48%.
Is it profitable to back class droppers?
Not on our figures. Big droppers have an A/E of 0.99 against Betfair SP in both handicaps and non-handicaps. In handicaps they lost 0.06% at Betfair SP after commission and 20.87% at industry SP.
Does a one-class drop help a handicapper?
Not on the headline figures: 9.95% against 10.48% for staying in the same class. Among horses that finished in the same place last time it does help a little, for example 9.28% against 8.64% for those that finished fourth to ninth.
Why do horses going up in class win as often as horses coming down?
Because they are often in form. In handicaps, 22.4% of horses going up one class won last time, against 3.8% of those coming down one. Among horses that completed the race last time, whatever their finishing position, the ones going up win least often.