
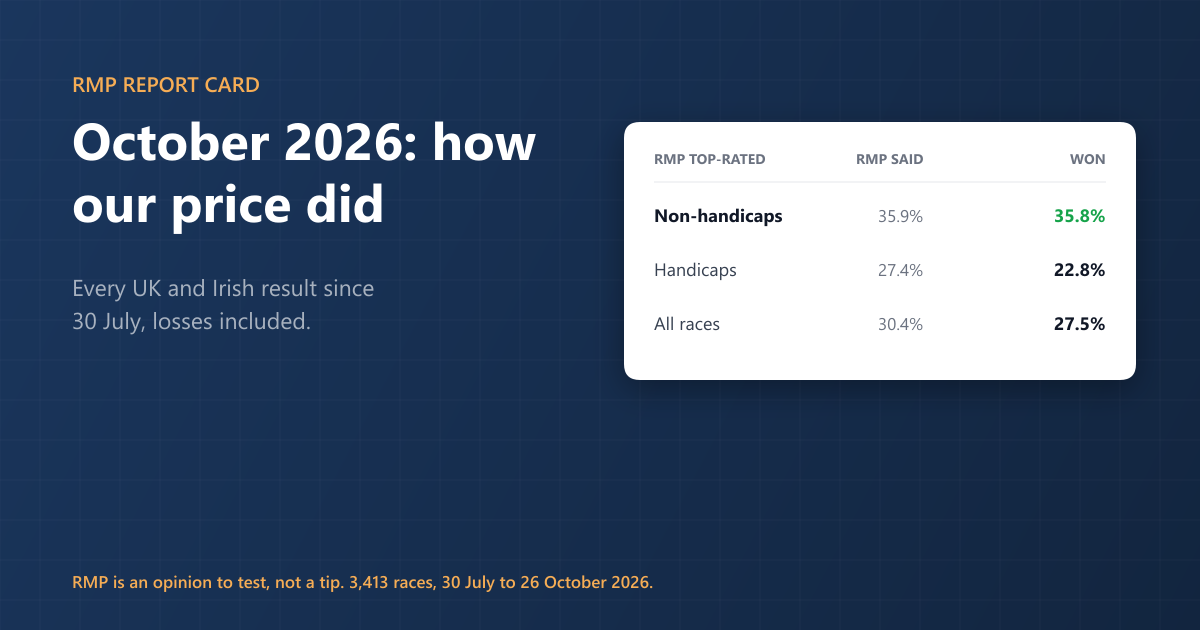
In October RMP's prices were the right size in every price band, within what chance allows. Over the 89 racing days since we started recording it, one fault stands out: in handicaps, the horses RMP fancies most win less often than it says. Where RMP and the evening market disagreed by a quarter or more, the market was nearer the result both ways, and the Betfair SP priced both groups about right.
“Work in progress to get these RMP ratings more accurate, early days so far but the results are promising.”
Simon Walton, RaceMetrics founder
RMP, the RaceMetrics Model Price, is a fair price we strike for every British and Irish runner each morning, before the market moves. This is its first monthly report card: what it said, what happened, and where it was wrong.
The short version
- October (1 to 26): 10,013 runners in 1,043 races. RMP's top-rated won 292 of them (28.0%) against the 30.0% RMP gave them. At Betfair SP they lost 1.1%; every runner lost 1.0%.
- The running total says RMP is too sure of its handicap fancies. In handicaps its top-rated won 22.8% against the 27.4% it said, over 2,199 races. In non-handicaps it was spot on: 35.8% against 35.9%.
- When RMP disagreed with the evening market, the market was closer. Where the market rated a horse at least 25% less likely than RMP did, it won 6.7%. RMP said 10.3%, the market 5.6%. The result landed about a quarter of the way from the market towards RMP.
- None of it made money at the early prices. RMP's top-rated lost 6.1% at the 10.30am price with best odds guaranteed, and 15.1% at industry SP.
- RMP is an opinion to test, not a tip. This page is where we check it in public, losses included.
How to read the numbers. RMP said is the win chance RMP's own prices gave a group of runners, re-based for non-runners exactly as the racecard shows it. A/E is winners divided by the winners the Betfair SPs implied: 1.00 means the exchange priced them right. Profit is to a level 1-point stake: Betfair SP after 2% commission, industry SP with no commission, and the morning price (bet365 at 10.30am, best odds guaranteed), the first early price taken after RMP is struck. To judge chance we use a chi-square test. Because this report looks at many lines, we only call a gap real when the score passes about 8. October is 26 racing days; the running total is 30 July to 26 October, 89 days.
1. Were RMP's prices the right size?
The first test of any price is simple. Take every horse RMP priced at, say, 2/1 to 3/1. If RMP is right, about a third of them should win. Here is every runner, grouped by RMP's price.
| RMP price (decimal) | October runners | October: RMP said / won | Since 30 Jul: runners | Since 30 Jul: RMP said / won |
|---|---|---|---|---|
| Under 2.0 (odds-on) | 87 | 59.0% / 54.0% | 293 | 60.4% / 52.2% |
| 2.0 to 3.99 | 648 | 33.4% / 31.8% | 2,151 | 33.3% / 31.3% |
| 4.0 to 7.99 | 2,044 | 17.0% / 17.2% | 6,657 | 17.2% / 17.2% |
| 8.0 to 15.99 | 3,187 | 8.9% / 9.2% | 10,255 | 8.9% / 9.8% |
| 16.0 to 33.99 | 2,551 | 4.6% / 4.8% | 8,123 | 4.6% / 4.4% |
| 34.0 and bigger | 1,496 | 1.8% / 1.6% | 4,887 | 1.8% / 1.8% |
October on its own is clean: every band sits within chance of what RMP said. The running total is not. RMP's odds-on shots won 52.2% of the time against the 60.4% it gave them (153 winners from 293, where RMP expected 177). Horses it priced between 8.0 and 15.99 won more often than it said: 1,001 winners where it expected 918. Both gaps just pass our bar for chance (chi-square 8.5 and 8.3). In plain terms, RMP has been a little too sure of the horses at the top of its list and a little too dismissive of the ones just behind them. The October odds-on group is only 87 runners, so we cannot yet say whether that has changed.
2. RMP's top-rated horse in each race
This is the number most readers look at first: back the horse RMP makes shortest in every race. We show the every-runner figure beside it, because backing everything loses money and a loss means little without that line next to it.
| Races / runners | Won | RMP said | A/E | Betfair SP | Morning (BOG) | Industry SP | |
|---|---|---|---|---|---|---|---|
| Top-rated, October | 1,043 | 28.0% | 30.0% | 1.02 | −1.1% | −5.1% | −13.8% |
| Every runner, October | 10,013 | 10.4% | 1.00 | −1.0% | −17.1% | −27.6% | |
| Top-rated, since 30 Jul | 3,413 | 27.5% | 30.4% | 0.97 | −3.3% | −6.1% | −15.1% |
| Every runner, since 30 Jul | 32,365 | 10.6% | 1.00 | −2.7% | −17.4% | −27.0% |
RMP's top-rated wins more than one race in four. At industry SP and the morning price it loses far less than backing every runner, but that is mostly because shorter-priced horses lose less at bookmaker prices, whoever picks them. At Betfair SP, where that effect is small, it did no better than backing every runner: −3.3% against −2.7% over the three months, with the market pricing the top-rated about right (A/E 0.97). And they won less often than RMP itself said: 27.5% against 30.4%, a gap well beyond chance over 3,413 races (chi-square 15.2). October's gap was smaller, 28.0% against 30.0%, and could be chance.
One horse distorts October's every-runner line. Indica won at Southwell on 19 October at a Betfair SP of 616.1. Take that one bet out and every runner in October lost 7.0% at Betfair SP, not 1.0%.
3. When RMP and the market disagreed, who was right?
We compared RMP with the evening show (bet365, 8.30pm the night before), with the bookmaker's margin taken out first. Then we took the runners where the two disagreed by a quarter or more, in each direction, and counted the winners.
| Runners | Evening market said | RMP said | Won | |
|---|---|---|---|---|
| RMP liked it more (market 25%+ less likely), since 30 Jul | 11,488 | 5.6% | 10.3% | 6.7% |
| RMP liked it less (market 25%+ more likely), since 30 Jul | 9,271 | 14.9% | 8.6% | 13.5% |
| RMP liked it more, October | 3,657 | 5.5% | 10.3% | 7.2% |
| RMP liked it less, October | 2,876 | 15.2% | 8.7% | 13.2% |
The market was closer both ways. Where RMP was keener, its horses won 6.7%, much nearer the market's 5.6% than RMP's 10.3%. Where RMP was cooler, they won 13.5%, nearer the market's 14.9% than RMP's 8.6%. But neither side was simply right. In both groups the result landed about a quarter of the way from the market towards RMP (24% and 22%). In October it was about a third (37% and 30%), on a smaller sample. So RMP's disagreements carry some information. They are not worth taking at face value.
Does that information pay? Not at the early prices.
| A/E | Betfair SP | Morning (BOG) | Industry SP | |
|---|---|---|---|---|
| RMP liked it more, since 30 Jul | 0.99 | −6.3% | −19.5% | −32.9% |
| RMP liked it less, since 30 Jul | 1.04 | +9.7% | −12.0% | −18.6% |
| RMP liked it more, October | 1.07 | −3.0% | −11.2% | −28.1% |
| RMP liked it less, October | 1.00 | +15.3% | −16.7% | −22.5% |
By the off the Betfair market had caught up: both groups came in close to an A/E of 1.00. The profit in the "RMP liked it less" line is not what it looks like. Indica was one of those horses (16/1 the night before, 616.1 at Betfair SP), and it alone is worth 604 points. Without it the line is +3.2% over the three months and −5.7% in October. Neither figure is clear of chance. Backing RMP's keener horses at the morning price lost 19.5%. The horses RMP liked more than the market were bigger prices than they should have been the night before, but not by as much as RMP thought, and by the off the exchange had corrected them.
4. Handicaps and non-handicaps: two different faults
We split everything by race type and by handicap or not. The handicap split told us the most, so it is the one we show.
| Since 30 Jul | Runners | RMP said | Won | October: RMP said / won |
|---|---|---|---|---|
| Handicaps: RMP top-rated | 2,199 | 27.4% | 22.8% | 26.5% / 22.6% |
| Handicaps: RMP under 4.0 | 1,309 | 34.5% | 28.6% | 33.9% / 28.3% |
| Handicaps: RMP 8.0 to 15.99 | 7,319 | 9.0% | 10.0% | 8.9% / 9.2% |
| Non-handicaps: RMP top-rated | 1,214 | 35.9% | 35.8% | 35.9% / 37.0% |
| Non-handicaps: RMP 16.0 and bigger | 4,569 | 3.3% | 2.2% | 3.3% / 2.5% |
Two different faults, and they partly cancel out in the overall table, which is why the first section looked tidier than RMP deserves.
- In handicaps, RMP is too sure of its fancies. Its top-rated won 502 races where it expected 602 (chi-square 24.3), and the gap was still there in October (148 against 173). The chance it takes from them belongs to the horses priced 8.0 to 15.99, which won 732 where RMP expected 656.
- In non-handicaps, RMP's top-rated is right to the decimal point: 435 winners, 435.5 expected.
- But in non-handicaps it gives the rank outsiders too much chance. Horses it priced at 16.0 or bigger won 100 races where it expected 151 (chi-square 17.9). October pointed the same way, on a smaller sample.
Over jumps the top-rated also fell short, 27.5% against the 34.0% RMP said over 874 races, with October's chases the weakest corner (24.2% against 36.5%, from 124 races). Jumps and handicaps overlap heavily and the main jumps season has only just begun, so treat that as one to watch, not a finding.
What this means if you use RMP. In a handicap, read RMP's shortest price as a little too short, and the horses just behind it as a little too long. In a non-handicap, do not take RMP's big prices on rank outsiders as a sign of hidden chance. And when RMP and the market disagree, the truth has usually sat nearer the market.
Next month
We will publish the same tables at the start of every month, the bad lines with the good, so you can see whether these faults close or widen. Three months is a short record, and October alone is too short to judge most of what is here.
Test it yourself: in the System Builder, add an RMP Rank or Evening Market vs RMP rule, then open the Breakdowns tab and split it by Handicap? and RMP Model Price.