The Paddy Power Gold Cup trends describe past winners well enough, but none of them has beaten the betting market, in the race itself or across more than a thousand runners in similar handicap chases. The one pattern worth watching is not on the usual trends list: horses that are usually held up have run below their prices in these races.
“To many, this is the first real big handicap chase of the jumps season, and plenty of long-in-the-tooth racing fans will still call it the Mackeson’s! Plenty of runners go on to run at the Cheltenham Festival in the same season.”
Simon Walton, RaceMetrics founder
The data bears him out. Of the 125 horses that ran in the last eight renewals (2018 to 2025), 56 (45%) ran at the Cheltenham Festival the following March. Four of them won there: Frodon (2019 Ryanair Chase), Sky Pirate (2021 Grand Annual), Coole Cody (2022 Plate) and Unexpected Party (2024 Grand Annual).
How to read the numbers. Every figure is measured against Betfair SP, which carries no bookmaker margin, so it is the fairest price to judge a group of horses against. A/E (actual over expected) is winners divided by the winners the prices said there should be: 1.00 is par, 1.10 means 10% more winners than the market expected. The ± figure is one standard error, roughly how far the number could wander by luck alone. A result inside two standard errors of 1.00 is not a finding.
Level stakes is the profit or loss from a 1-point win bet on every horse in the group, at Betfair SP after 2% commission and at industry SP.
The race
The Paddy Power Gold Cup is the big handicap chase of Cheltenham's November meeting: about two and a half miles (2m4f44y on our records), on the Saturday, worth around £150,000 to £160,000. It ran as the BetVictor Gold Cup in 2018 and 2019 and has carried the Paddy Power name since 2020. To find every running we searched by course, month, race type, trip and handicap status rather than by title, so a change of sponsor does not lose a year.
Our race records start in 2018. That gives eight runnings and 125 runners.
| Year | Winner | Age | Weight / OR | SP | Betfair SP | Last run | Days off |
|---|---|---|---|---|---|---|---|
| 2018 | Baron Alco | 7 | 10-11 / 146 | 8/1 | 11.0 | 2nd, chase, Chepstow | 34 |
| 2019 | Happy Diva | 8 | 11-0 / 143 | 14/1 | 20.8 | 2nd, chase, Wetherby | 15 |
| 2020 | Coole Cody | 9 | 10-5 / 137 | 10/1 | 15.0 | 2nd, chase, Cheltenham | 21 |
| 2021 | Midnight Shadow | 8 | 11-5 / 147 | 9/1 | 11.5 | 3rd, chase, Aintree | 20 |
| 2022 | Ga Law | 6 | 11-0 / 142 | 5/1 | 5.5 | 3rd, chase, Aintree | 20 |
| 2023 | Stage Star | 7 | 11-7 / 155 | 4/1 fav | 5.5 | 5th, chase, Aintree | 219 |
| 2024 | Il Ridoto | 7 | 9-13 / 141 | 10/1 | 11.2 | 5th, chase, Chepstow | 35 |
| 2025 | Panic Attack | 9 | 11-1 / 135 | 6/1 | 8.5 | 2nd, hurdle, Warwick | 280 |
Weight is the weight carried, after any jockey's claim. Betfair SP is shown as decimal odds.
Two things stand out before any trend is tested. The winners came from a narrow price band: every one was between 4/1 and 14/1, and none was a big outsider. And the race has shrunk: 16 to 19 runners from 2018 to 2021, then 14, 14, 15 and 12 last year.
The trends, checked against the winners
These are the lines that turn up most in Paddy Power Gold Cup trend pieces. Here is how our eight winners fit them:
| The claim | Our count, 2018 to 2025 |
|---|---|
| Most winners are aged 7 to 9 | 7 of 8 |
| Most winners are rated 139 or higher | 6 of 8 |
| Most winners had already won at Cheltenham | 4 of 8 |
| Most winners had run six or more times over fences | 5 of 8 that we can see |
Near enough. But a trend only tells you who won. It does not tell you whether the winners were a surprise to the market. That is the question that matters to anyone betting.
Inside the race: what the market expected
| Paddy Power Gold Cup, 2018 to 2025 | Winners | Runners | Expected winners | A/E | Level stakes, Betfair SP | Level stakes, SP |
|---|---|---|---|---|---|---|
| Every runner | 8 | 125 | 8.1 | 0.98 | −29% | −41% |
| Aged 7 to 9 | 7 | 91 (73%) | 6.1 | 1.15 ±0.41 | −9% | −25% |
| Rated 139 or higher | 6 | 93 (74%) | 6.5 | 0.92 ±0.39 | −30% | −40% |
| Had won at Cheltenham | 4 | 46 (37%) | 3.5 | 1.13 ±0.53 | −21% | −28% |
| Six or more chase runs | 5 | 77 (62%) | 4.4 | 1.13 ±0.47 | −30% | −39% |
Every trend group lost money at both prices. The age trend looks strongest, 7 winners from 6.1 expected, but that is one winner more than the prices implied. It is well inside the noise. Horses aged 7 to 9 are three-quarters of the field, so most winners will be 7 to 9 whatever happens.
Eight races cannot separate an edge from a lucky run. So we widened the question to every race that looks like this one.
Across similar races: the trends are priced in, or not there at all
The comparison set is every British and Irish Class 1 or Class 2 handicap chase from 2m3f to 2m6f run in October, November or December since 2018: 135 races and 1,329 runners. For the Cheltenham trend we also looked at every Cheltenham handicap chase over the same trip, in any month: 90 races and 1,086 runners.
| Class 1 and 2 handicap chases, 2m3f to 2m6f, Oct to Dec | Runners | Strike rate | Rest of field | A/E | Level stakes, Betfair SP | Level stakes, SP |
|---|---|---|---|---|---|---|
| Every runner | 1,329 | 10.2% | 0.99 | +8% | −15% | |
| Aged 7 to 9 | 921 | 9.8% | 11.0% | 0.99 ±0.11 | +8% | −15% |
| Rated 139 or higher | 584 | 9.2% | 10.9% | 0.91 ±0.13 | +1% | −18% |
| Had won at that course | 307 | 12.7% | 9.4% | 1.04 ±0.16 | +1% | −14% |
| Six or more chase runs (2022 on) | 492 | 10.0% | 18.8% | 0.93 ±0.14 | −12% | −26% |
| Cheltenham only: had won at Cheltenham | 239 | 10.9% | 7.6% | 1.12 ±0.21 | 0% | −16% |
Three things happen here.
- Age and rating are not real. Horses aged 7 to 9 win slightly less often than the rest, and so do horses rated 139 or higher. Both groups are simply most of the field. The market prices them almost exactly.
- Experience runs the wrong way. Horses with six or more chase runs won 10.0% of the time. The less experienced chasers won 18.8%, and beat their prices too (19 winners from 15.8 expected). That is still under one standard error, so it is not a reason to back novices. It is a reason not to insist on experience.
- Course form is real, and the market knows. Horses that had already won at the track win more often: 12.7% against 9.4%, and at Cheltenham 10.9% against 7.6%. But they are priced for it. An A/E of 1.12 at Cheltenham is about half a standard error from par, and they lost money at industry SP.
The Betfair SP column for the whole set is positive, +8%. That comes from a handful of big-priced winners. Industry SP shows the real picture for anyone betting at a bookmaker: every group lost.
The verdict on each trend
| Trend | Verdict |
|---|---|
| Aged 7 to 9 | Not real. It describes most of the field. |
| Rated 139 or higher | Not real. These horses win slightly less often, and are priced to. |
| Had already won at Cheltenham | Real but priced in. |
| Six or more runs over fences | Not real. If anything it runs the other way. |
Something the trends miss: how the horse is ridden
No trends table asks how a horse is ridden. We sorted every runner by its usual run style, taken from its last ten runs before the race (so it is known in advance), and compared each group with its prices.
| Usual run style | Cheltenham handicap chases, 2m3f to 2m6f: winners / expected | A/E | Class 1 and 2, Oct to Dec: winners / expected | A/E |
|---|---|---|---|---|
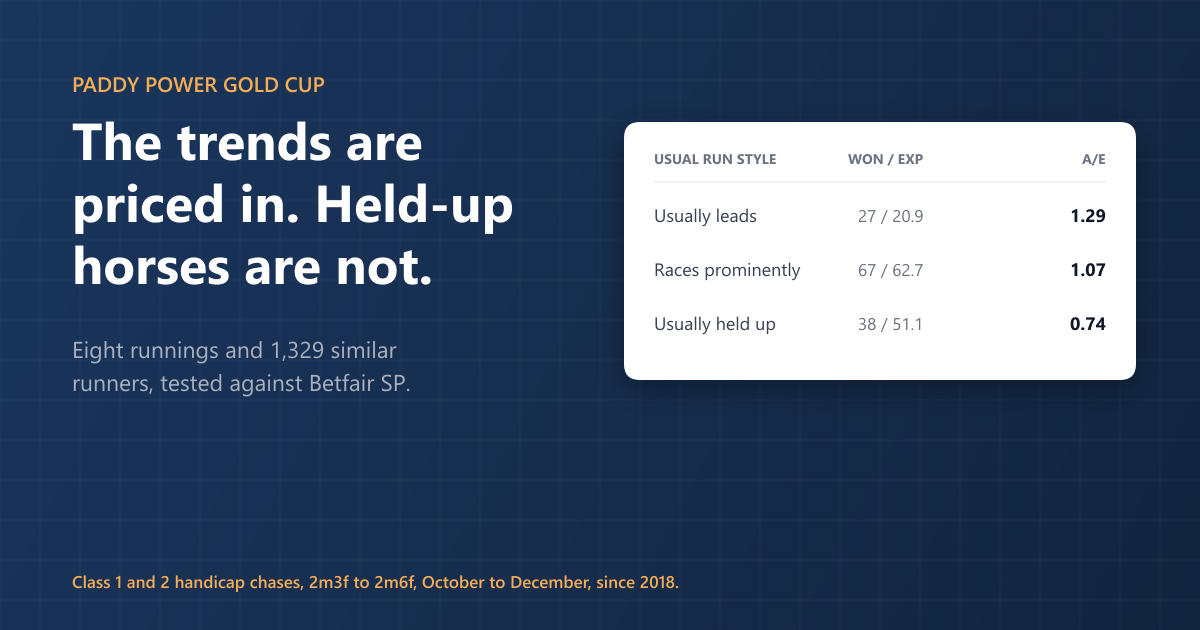
| Usually leads | 19 / 15.5 | 1.23 | 27 / 20.9 | 1.29 |
| Usually races prominently | 45 / 44.2 | 1.02 | 67 / 62.7 | 1.07 |
| Usually held up | 23 / 27.6 | 0.83 | 38 / 51.1 | 0.74 |
The pattern is the same in both sets. Horses that are usually held up win less often than their prices say, and front-runners win more. In the wider set the held-up horses lost 41% at industry SP. In the Paddy Power Gold Cup itself, the usual hold-up horses supplied 2 winners from 50 runners, against 2.8 expected.
We tried several lines to find this, so we hold it to a higher bar. The strongest figure, 0.74 for held-up horses, sits a little under two standard errors below par. With this many lines tested, that is a pattern worth watching, not proof. It does not mean a held-up horse cannot win. It means the market has tended to give them too much credit in these races.
How to use this on the day
- Build the comparison in the System Builder. Race Type Chase, Handicap Yes, Distance (furlongs) 19 to 22, Class 1 to 2, Month October to December. That is the set every figure above comes from.
- Add one trend at a time. Course Wins (career) 1 or more, Age 7 to 9, Official Rating 139 or more, Chase Runs (career) 6 or more. Watch the A/E, not the strike rate. A trend that wins more often but scores 1.00 is already in the price.
- Open the Breakdown for Usual Run Style, then try it against Distance on the Grid, to see where the held-up horses do and do not struggle.
- On the day, open the race's Race Guide and racecard. Check how each runner is usually ridden, its course form and its price. RMP is an opinion to test against the market, not a tip, and it has no history in this race yet.
- Save the system as Active and its qualifiers will show on the day for this race and every similar one.
The take
The Paddy Power Gold Cup trends are a fair description of who has won. They are not a way to beat the price. Age and rating describe most of the field, course winners win more and are priced for it, and the experience trend points the wrong way. If there is anything here the market has been slow on, it is the way a horse is ridden, and even that is a thread to watch rather than a system.
Questions we get asked about this
What age wins the Paddy Power Gold Cup?
Seven of the eight winners since 2018 were aged 7 to 9. But horses of that age are 73% of the runners, and across 1,329 runners in similar races they win slightly less often than the rest, with an A/E of 0.99 against Betfair SP.
Do Cheltenham course winners do well in the Paddy Power Gold Cup?
They win more often than other runners, but they are priced for it. In Cheltenham handicap chases over the same trip, previous course winners won 10.9% of their races against 7.6% for the rest, with an A/E of 1.12, about half a standard error from par.
Do front-runners have an edge at Cheltenham over two and a half miles?
Horses that usually lead have beaten their prices in these races (A/E 1.23 at Cheltenham, 1.29 in Class 1 and 2 races over the same trip), and horses that are usually held up have fallen short (0.83 and 0.74). The pattern is consistent but not yet strong enough to call an edge.