
Every jumps season starts with the same question: which of last season's horses are worth following? We looked for a rule in seven seasons of results, wrote it down, and applied it to every British and Irish jumps horse that ran in 2025/26. The result is a list of 232 horses, and it now has its own page: Jumps Horses to Follow.
The rule
A horse makes the list when both of these are true:
- Its official rating (OR) rose 7lb or more last season. We compare its mark at its first run of the season with its mark at its last run, and only within one code: a hurdles mark against a hurdles mark, a chase mark against a chase mark. A horse that switched codes can show a big change in its mark that says nothing about improvement.
- It won or placed on its last run of the season. It finished the season in form, not on the way down.
That is all. No ratings of our own, no prices and no judgement go into choosing a horse, so the list cannot be bent to fit what we hoped to find.
Why both halves
We tested the rule the honest way. For each season from 2018/19 to 2024/25 we built the list from that season's runs alone, then followed every horse on it through its first six runs of the next season, at Betfair Starting Price (BSP) after 2% commission. A/E in the table below is the number of winners against the number the Betfair price expected: 1.00 means the market had it right, and anything above 1.00 means the horses won more often than their prices said.
| Horses followed the next season | Runs | A/E | Return at BSP |
|---|---|---|---|
| Mark up 5lb+, won or placed last time | 7,562 | 1.08 | +10.6% |
| Mark up 7lb+, won or placed last time (the list) | 5,563 | 1.12 | +16.9% |
| Mark up 10lb+, won or placed last time | 3,392 | 1.13 | +13.3% |
| Mark up 7lb+, NOT placed last time | 12,062 | 0.99 | -2.3% |
| Mark flat or down, won or placed last time | 18,781 | 0.99 | -4.3% |
| Every jumps horse | 158,207 | 1.00 | -3.8% |
Look at the two rows below the list. A horse still improving but out of form at the end of the season did no better than any other horse. Neither did a horse in form whose mark had not moved. The market prices each half on its own. It is the two together, a horse the handicapper has had to keep raising and which was still running well at the end, that the next season's prices did not catch up with.
We settled on 7lb because it gave the best balance. At 10lb the horses did win a little more often against their prices, but there were far fewer of them and the return was lower.
Season by season
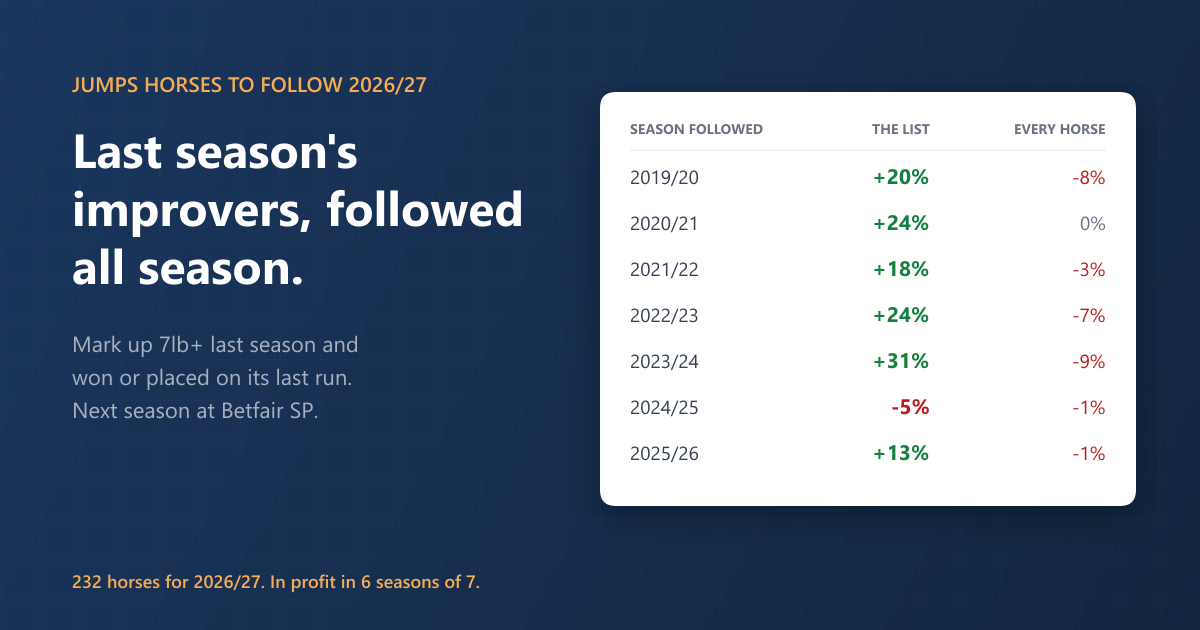
A rule that worked in one lucky season is no use, so here is each season the list was followed into, against the return from backing every jumps horse in the same season:
| Season followed | The list | Every jumps horse |
|---|---|---|
| 2019/20 | +20% | -8% |
| 2020/21 | +24% | 0% |
| 2021/22 | +18% | -3% |
| 2022/23 | +24% | -7% |
| 2023/24 | +31% | -9% |
| 2024/25 | -5% | -1% |
| 2025/26 | +13% | -1% |
Six seasons of seven in profit, and one losing season. The returns lean on bigger-priced winners, so long losing runs are part of following the list.
The stronger half: last run in Class 1 or 2
Of the 232 horses, 94 had their last run of last season in a Class 1 or Class 2 race. In the history those horses did best of all: an A/E of 1.15 and a return of +31.9% at BSP over 2,108 runs, against +7.7% for the horses whose last run was in Class 3 or lower. They carry a Class 1-2 tag on the page, and one click shows them alone.
Among them are Sue Smith's Konfusion (rated 115 at the start of last season and 145 at the end, third at Aintree in April), C A Murphy's mare Zanoosh (up 29lb, second in a Grade 1 novice hurdle at Punchestown), Kim Bailey's White Noise, Jamie Snowden's Johnny's Jury and Denis Gerard Hogan's Cousin Kate.
And the horses to treat with caution
The same research turned up a group that went the other way. Jumps horses whose last run of the season ended in a fall, an unseat, a slip or being brought down returned -18% at Betfair SP the next season (an A/E of 0.91 over 5,338 runs) and lost money in all seven seasons. The 30 highest-rated of them from last season are on the page's Fell last time tab.
What the page shows
- One line per horse: trainer (and its old trainer if it has moved yards), its mark at the start and end of last season, its last run of last season and its current RaceMetrics Rating.
- This season: how many times it has run and won. Click a line to see every run, with its finishing position and Betfair SP.
- Next: its next declared run, or its five-day or four-day entry before the declarations, linked to the racecard.
- The list's own record this season at BSP, every runner on the list counted, winners and losers alike.
- Filters for Class 1-2 only, entered or declared, run this season, British or Irish yards, and a search for a horse or trainer.
The list was drawn up from last season's runs alone and will not change during the season, so its record is a fair test. Since 1 October it reads 15 winners from 68 jumps runs and +7.87 points at Betfair SP. That is early days: the history says a bad month will come.
Winners as they happen
When a horse on the list wins a jumps race, we post it on our X, Bluesky and Facebook accounts once the race has weighed in, with the list's record to date in every post. Losers count in that record just the same, so the posts keep score honestly.
Who can see it
The full list is part of RaceMetrics Enterprise, RaceMetrics Pro and Proform Premium. Every other signed-in member sees the first ten horses and the list's record. It is a list to follow and test, not a set of tips.
Open Jumps Horses to Follow from the Racecards menu.