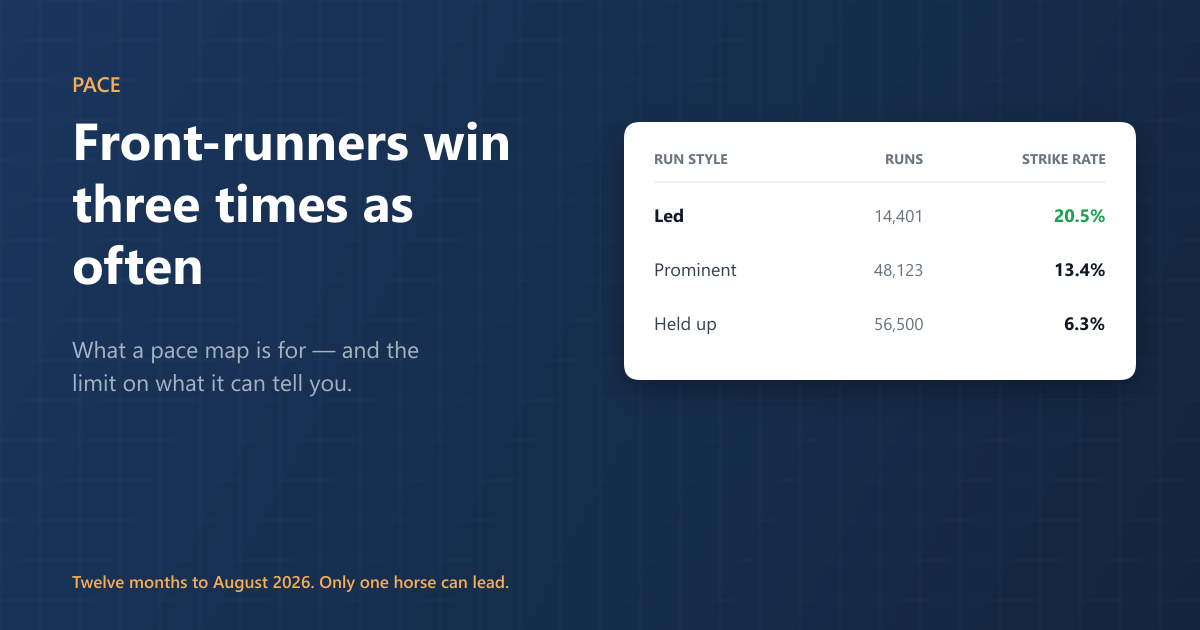
Over the last twelve months of British and Irish racing, horses that led won 20.5% of the time. Horses that raced prominently won 13.4%. Horses held up won 6.3%.
That is 119,024 runs, and the gap between the top and bottom of it is more than three to one. Whatever else is true about pace, it is not a detail.
| Run style | Runs | Wins | Strike rate |
|---|---|---|---|
| Led | 14,401 | 2,958 | 20.54% |
| Prominent | 48,123 | 6,461 | 13.43% |
| Held up | 56,500 | 3,556 | 6.29% |
The honest caveat, up front
Run style is recorded after the race. So this table cannot tell you that front-running causes winning — a good horse often leads because it is quick away and better than the opposition, and it would have won from anywhere. Some of that 20.5% is the horse, not the tactic.
But not all of it. Note how few horses lead: 14,401 runs against 56,500 held up. Only one runner can lead, and in a race where nothing else wants to, the one that does gets an uncontested advantage that has nothing to do with merit. That is the part a pace map is trying to find.
What a pace map actually shows
A pace map takes each runner's habitual position in its recent races and lays the whole field out on one picture, so you can see the shape of the race before it is run. Read across it and the questions answer themselves:
- How many want the lead? One is a gift. Four is a war, and the beneficiaries are the horses coming from behind.
- Is anything drawn to be uncontested? A confirmed front-runner alone on the pace map is the single most useful thing it shows you.
- Where is the bulk of the field? A race full of hold-up horses is a race that may be run at a crawl, which turns it into a sprint from the back straight and suits something entirely different.
Crucially the map describes intentions, drawn from what each horse has habitually done. It is a forecast, and forecasts are wrong. A horse can be dropped in, a jockey can change the plan, a bad start can rewrite everything.
Pace is a course-and-distance question too
The same run style is worth different amounts at different tracks. A tight, turning five furlongs where the field cannot get past is a different proposition from a galloping mile with a long straight, and the numbers bear that out track by track.
That is why the pace statistics on the race guides are held per course and distance rather than as one national figure, calculated as impact values and updated automatically as declarations and results come in — including whenever a course runs a distance it has not used before. A national average for front-runners would be close to useless for the race in front of you; the figure for this course over this trip is not.
How to use it without over-reading it
- Count the leaders first. The number of horses that want the front matters more than which one gets there.
- Check the course-and-distance pace stats before deciding a front-runner is well placed. Some tracks reward it hugely; some barely at all.
- Treat a lone front-runner as a positive and a contested lead as a negative — for the leaders, and as a positive for everything held up.
- Remember it is a prediction. A pace map is the most useful guess available, not a fact about a race that has not happened.
The strongest use of pace is not picking front-runners. It is spotting the races where the likely shape contradicts the market — the well-backed hold-up horse in a race with no pace to aim at, or the unconsidered leader who is going to get an easy lead nobody else wanted.