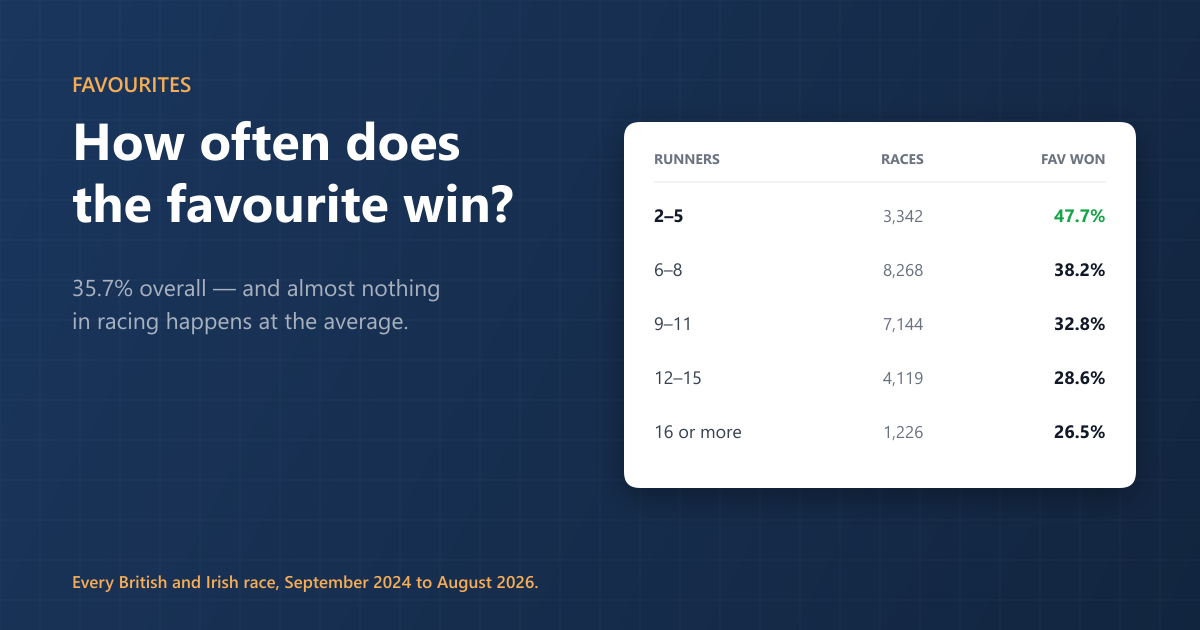
The favourite wins about 35.7% of races in Britain and Ireland — a little better than one in three. That figure comes from every race run in the two years to the end of August 2026, 24,099 of them, and it is the single most requested number in racing.
It is also the least useful, because almost nothing in racing happens at the average.
Field size changes everything
The favourite's job gets harder with every rival added, and it gets harder faster than most people expect.
| Runners | Races | Favourite won |
|---|---|---|
| 2–5 | 3,342 | 47.7% |
| 6–8 | 8,268 | 38.2% |
| 9–11 | 7,144 | 32.8% |
| 12–15 | 4,119 | 28.6% |
| 16 or more | 1,226 | 26.5% |
A short-priced favourite in a four-runner race and a short-priced favourite in a twenty-runner handicap are described by the same word and are not remotely the same proposition. One wins nearly half the time. The other wins about a quarter.
Handicaps are where favourites go to struggle
Split the same two years by the type of race instead, and a second pattern appears that is arguably stronger than the first.
| Race | Races | Favourite won |
|---|---|---|
| Jumps, non-handicap | 3,970 | 46.5% |
| Flat, non-handicap | 4,934 | 43.4% |
| Jumps, handicap | 5,497 | 31.2% |
| Flat, handicap | 9,698 | 29.9% |
Favourites win close to half of all non-handicaps and under a third of handicaps. That is the handicapper's entire job description, stated as a statistic: a race where the weights are set to bring the field together is a race where the best horse wins less often.
Notice also how little separates the two codes once you have accounted for the type of race. Jumps favourites do marginally better than Flat ones in both columns, and the gap between handicap and non-handicap dwarfs the gap between the codes.
What this does not mean
It does not mean back favourites in small non-handicap fields. It is worth being blunt about that, because it is the conclusion people reach.
The market already knows all of this. A favourite in a four-runner novice chase is short precisely because it wins about half the time, and the price reflects it. These figures describe how well calibrated the market is; they are not a gap in it. What they are useful for is context — knowing that a 33% shot in a big handicap is behaving normally, while a favourite beaten in a five-runner race is a slightly more unusual event than it feels.
The number that is actually worth looking at
The average across two years is a poor guide to this afternoon. What matters far more is how favourites have fared in this race, at this course, over this trip — and that is a different question, with a different answer for every race on the card.
The Race Guides carry a fate-of-the-favourites table for exactly that reason: the historical record of favourites in the race in front of you, rather than the sport-wide average. Some course-and-distance combinations are notably kind to favourites and some are graveyards, and neither fact is visible in the 35.7%.
Use the overall figure to calibrate your expectations. Use the race-specific one to inform a bet.
Two footnotes on the arithmetic
- These are outright favourites only. Joint-favourites are recorded separately and are excluded throughout — including them would inflate the win rate by counting two horses in a single race as "the favourite".
- This is win rate, not profit. A 47.7% strike rate at odds-on can lose money all day. Strike rate answers "how often", never "was it worth it" — for that you want A/E, which is a subject of its own.