Over the last fortnight six people asked us for the same thing, in six different ways, through two different tools.
Below the last winning handicap mark and dropping in class. At or below a course-and-distance winning mark. An official rating at least five pounds under the highest mark it has won off. And, by email, a request for the change in mark from a horse's last winning run to today.
It is one of the oldest ideas in handicap betting: the handicapper has let a horse down, and today it gets its chance. When that many people ask inside two weeks, it is worth testing rather than building.
So we tested it.
What we measured
Every British and Irish handicap run from January 2020 to July 2026 where the horse had a previous good run on record — a win or a placed effort — and had an official rating and a Betfair price. That is 395,129 runs, around 164 a day.
For each one we took the mark the horse carried at that last good run, subtracted today's mark, and looked at what happened next. We judged it on A/E rather than on profit. A/E compares how often a group of horses actually won against how often their prices said they would. 1.00 means the market priced the group exactly right. Above 1.00 means the market underrated them. It is the honest measure, because a profit figure can be one big-priced winner.
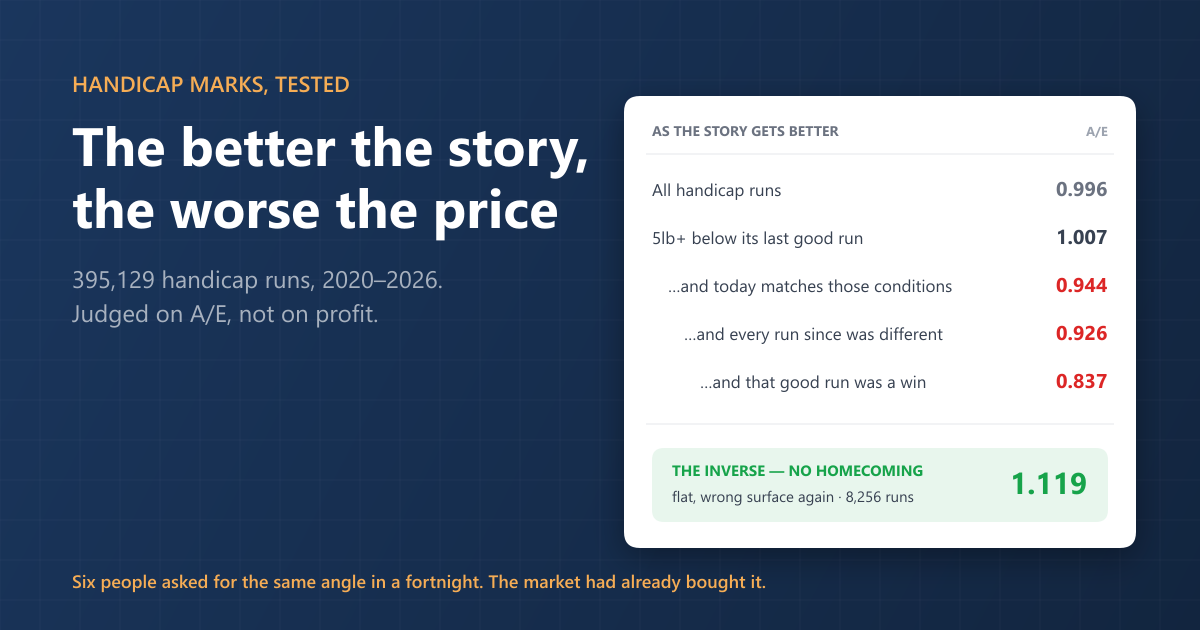
The baseline: 11.2 per cent win rate, A/E 0.996. The market prices British and Irish handicaps almost exactly right, which is where every one of these tests starts.
The results
Take horses running off a mark five pounds or more below their last good run. That is 65,004 runs. They win 7.5 per cent of the time — well below the 11.2 per cent baseline, because the handicapper is usually right. Their A/E is 1.007. Priced fairly.
Now add the part that makes it a story. Today's race matches the conditions of that good run — same going band, same trip, same or easier class, same code. That narrows it to 14,789 runs. Still 7.5 per cent winners, but A/E falls to 0.944.
Now add the rest of the narrative: every losing run since that good effort came under different conditions, so the mark slid while the horse was being asked the wrong questions. 7,603 runs. A/E 0.926.
And the strongest version of the story, where the good run was an outright win: 1,974 runs, 6.4 per cent winners, A/E 0.837.
The pattern is the wrong way round from the one everybody wants. The better the story reads, the worse the price. Adding each narrative layer makes the horse a slightly worse bet, not a better one.
It holds in both halves of the period. Split 2020-22 against 2023-26 and the same three cohorts read 0.98 then 0.94, 0.92 then 0.94, 0.90 then 0.79. Place returns were negative in every cohort. The strict jumps version, at 380 runs, came back at 0.49 — a small sample, but around three standard deviations from par.
Why
Not because the reasoning is wrong. Because it is obvious.
Anyone reading a card can see a horse is fifteen pounds lower than when it won, and can see it is back on the ground it likes. It is written on the page. The market reads it too, and prices it, and then a few people price it twice.
This is the same lesson our draw and pace testing produced, and the same lesson the percentile-score work produced. The narratable factor gets bought. What survives is usually the thing nobody wants to write a sentence about.
The version that is mispriced
There is one, and it is the exact inverse.
Flat only. The horse is five pounds or more below its last good run, every run since has been under different conditions — and today is under different conditions again. No homecoming. Nothing to like.
8,256 runs. 7.5 per cent winners, the same strike rate as all the others. A/E 1.119, and 12 per cent above Betfair starting price after commission. It reads 1.112 in the first half of the period and 1.124 in the second.
The driver is a surface switch: horses whose good run came on turf now running on all-weather, or the reverse. That is 5,463 of the runs, at A/E 1.148. A going mismatch alone is par at 1.00.
Two things temper it. All of the edge is at a price — 1.10 at 5.0 to 10.0, 1.19 to 1.21 above 10.0, but 0.91 below 5.0, so backing the short ones undoes it. And place returns are negative here too.
We are calling this a lead worth a live season rather than a system, and we would rather say that than quote you the return on the big-priced runners as though it were an edge.
Building it yourself
Most of this is already in the System Builder today. Search the filters for "winning" and you get Lbs Below Highest Winning OR — the highest mark the horse has won off, minus today's — and the raw highest winning mark on its own. Search "since last win" for runs and days since the last win. Class movement, going, distance and race code are all there, and the breakdowns will split any of them for you.
What is not there yet is the mark at the last good run as opposed to the last win, and a count of how many runs since then came under different conditions. That is the difference between the version you can build today and the version we tested. We would rather tell you that than let you assume the two are the same.
One closing thought for anyone who reads this as bad news. Knowing an angle is fairly priced is worth as much as finding one that is not, because it is one fewer thing to pay over the odds for. The four-and-a-half thousand runs at the end of this article are only visible because we tested the thirty thousand in the middle and found nothing.