Every serious form student ends up with a view on what a beaten length is worth. Three lengths in a five-furlong sprint is not three lengths in a staying chase. Soft ground stretches the field. A horse carrying top weight and finishing half a length down has done more than the bare result suggests.
The problem has never been having the view. It has been doing the arithmetic — race after race, day after day, until you stop.
Do it once, not once per race
My Ratings asks you to make your method explicit exactly once: what a beaten length costs in pounds, varying by race type, going and distance. Then RaceMetrics rates every runner in every race with it — your whole recent history the moment you set the scale up, and every new result each morning after that.
There is nothing to type, ever. No opening a race, entering the winner's figure, pressing calculate, saving, and moving to the next one.
Pick one of six presets in plain English — Balanced, Sharp, Gentle, Soft-ground biased, or two speed-figure options — or choose Start from scratch and design your own: which race types and going each block covers, your own pounds-per-length pins, weight-for-age on or off. A live preview scores a real race before anything is computed, so you can see what your choices do before you commit to them.
Why the figures read like official marks
Each performance is anchored on the class par — the mark a typical winner of that class, trip and going carries — then credited with the weight the horse actually carried relative to the winner, and debited for its beaten distance on your own curve.
Because every race is anchored the same way, the figures are comparable across courses, classes and seasons, and they sit on the same scale as the official BHA mark. It is the same idea as the Racing Post's RPR, built to your method rather than someone else's.
Weight-for-age is applied by default, using the official unified European flat scale and the Anglo-Irish jumps scale. That matters more than it sounds: without it, three-year-olds rate around two pounds light against their own marks, purely because the scale ignores their age allowance. Same-age races are unaffected — only mixed-age ones shift, exactly as the handicapper intends.
Speed figures, on the official scale
For the timing school, there are two speed-figure options. The first applies the classic rule from the timing literature to the Proform speed figure — one point per 2.4 lbs carried either side of nine stone — so the figures you already know start crediting horses that ran their time under a burden.
The second, Speed figures on the OR scale, re-expresses those figures in official-ratings points, so a figure reads like a handicap mark rather than a clock number. It anchors each race on its class par and converts each horse's figure margin to the winner into pounds, calibrated separately for turf, all-weather, chase and hurdle from every officially-rated run since 2018. Checked against 2026 racing — outside the period it was calibrated on — the figures land within about a pound of the average official mark, with the same spread of values.
Then find out whether they are any good
This is the part that manual rating has never offered. Your figures appear as a sortable My column on racecards, At-a-Glance, Form Expert, the A-Z Runners page, horse profiles and My Card — up to three scales at once, side by side on the same card. But seeing them is not the point. Testing them is.
- The Scorecard tracks how your pre-race top-rated has actually performed over 30, 90 or 365 days: strike rate, level-stakes return at Betfair SP, and A/E against the market.
- Review winners replays any settled day race by race — who won, where your scale had the winner ranked before the off, and how your own number one got on.
- The System Builder carries a My Ratings filter group, so you can back-test your method against real Betfair prices with the same A/E, drawdown and holdout checks every other system gets — and each rule can read a different one of your scales, so one system can say my speed scale rates it top and my lengths scale has it in the top three.
- Daily qualifiers turn a saved rule into a selection list: mark it Active and your top-rated arrive in the qualifiers email each morning. A Divergence Finder shows the runners you rate number one that the RaceMetrics ratings do not.
One distinction worth understanding
Every run carries two figures, and they answer different questions.
My Rating (pre-race) is what your scale said going into the race — the horse's best from its last three rated runs, exactly what the racecard showed before the off. Back-test this one. A filter on it is a selection you could actually have made, and it is the same basis the daily qualifiers use, so what you test is what lands in your inbox.
My Rating without the label is what the horse earned in the race, worked out from the result. It is excellent for studying how your scale behaves — but it is hindsight. Filter on earned rank 1 and you will see a strike rate above 60%, because you are describing what already happened rather than picking anything. If a back-test looks too good to be true, check which of the two you are on.
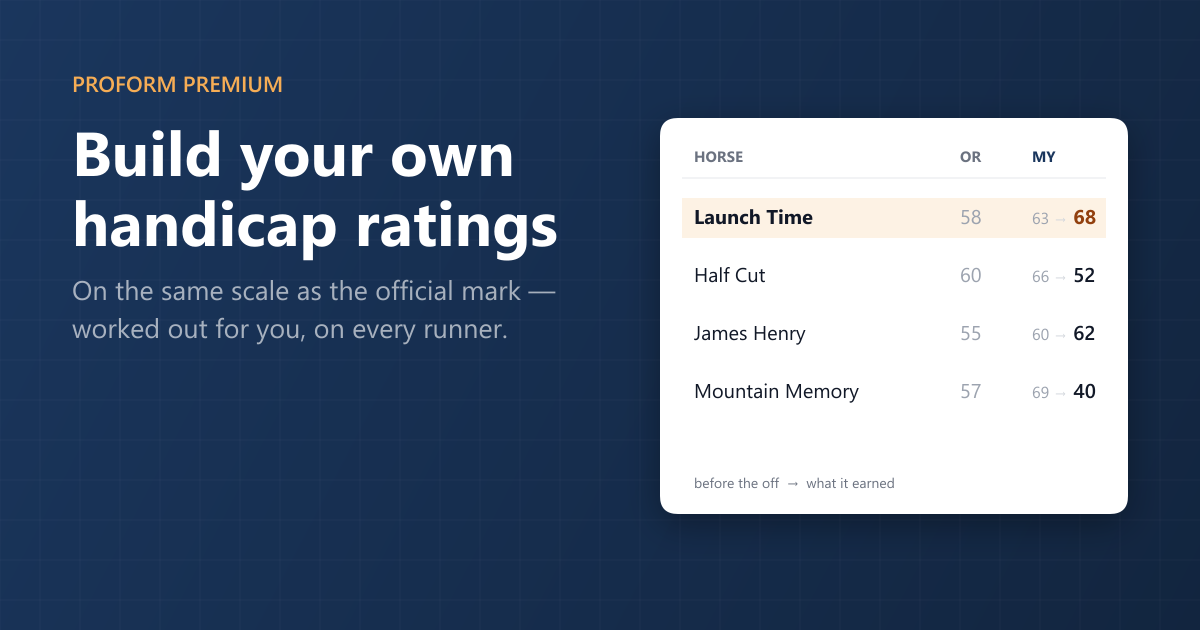
You can see both at once. On a settled racecard the My column now reads 63 → 68: the muted first number is what your scale had the horse on going into the race, the second is what it earned. Yesterday's Cork handicap makes the point — the winner earned 68 and finished top-rated on the day, but that same scale had it tenth of seventeen before the off. Upcoming cards show the single pre-race figure, because there is nothing yet to earn.
The pre-race back-test also counts your top-rated horses that fell or were pulled up, as the losing bets they were. Leaving those out would flatter every figure by around three per cent, because a horse that fails to finish never wins. Only genuine non-runners come out — and those change the ranking, exactly as they do on the racecard.
The same split applies to the official mark. My Rating minus OR (pre-race) is your figure before the off minus the horse's BHA mark — the honest version of “I rate this one ahead of the handicapper”, and it works in the daily qualifiers. Its earned twin is labelled accordingly, and the gap between them is instructive: on one member's scale, filtering on the earned figure being above the mark returns a 60%-plus profit, while the pre-race figure over 77,000 runs comes out at an A/E of 1.00. A horse that ran well is above its mark by definition. That difference is the whole lesson.
What the numbers actually say
Worth being straight about this: on our own scales, the pre-race top-rated runs at an A/E just under 1.00 over tens of thousands of selections. That means the market has those horses about right on their own.
That is the normal starting point, and it is precisely why the Scorecard and the Builder exist. The value in a personal rating rarely comes from the raw top-rated list. It comes from finding the conditions where your figures and the market disagree — and now you can measure that instead of guessing at it.
My Ratings is part of Proform Premium. Set up your first scale from Racecards → My Ratings in the menu, or the My Ratings chip on any racecard; your history is rated in a few minutes, and every result after that looks after itself.