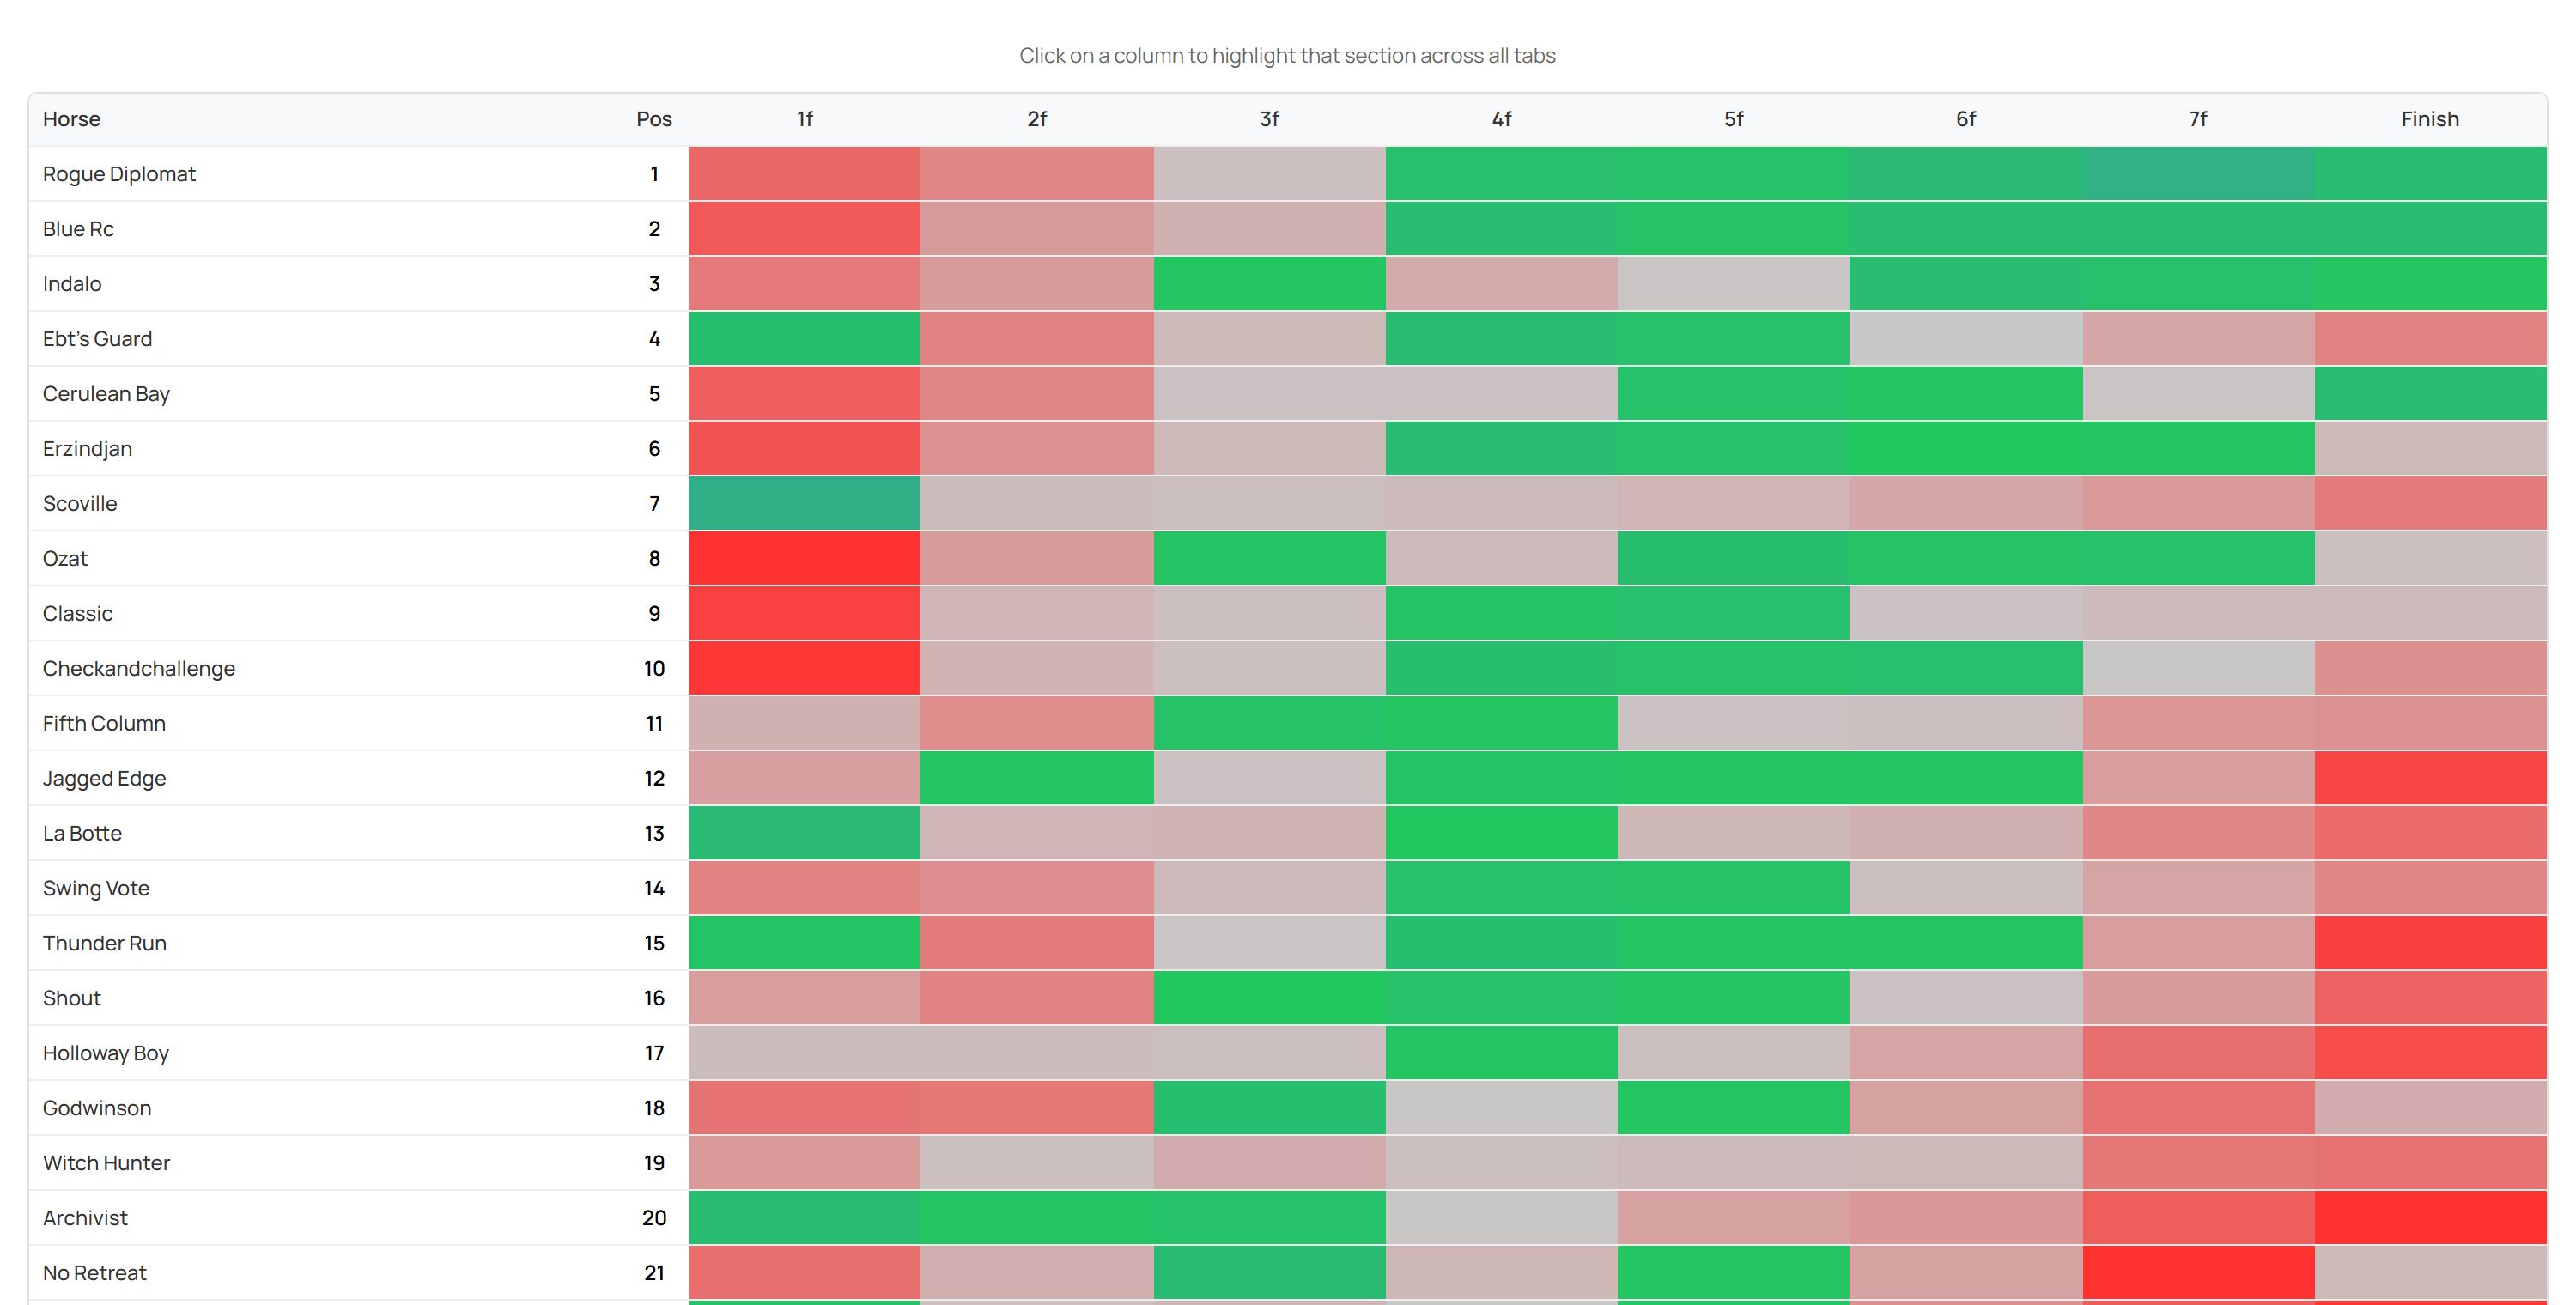
It's all measured against par — not a flat 100
The one thing to understand before everything else. Every figure is judged against the race's par: a ground-adjusted benchmark, calibrated to the actual winning time and adjusted for going, class and weight — so it varies section by section, and sits in the header above every column.

- ✓ Par is shown above each column and changes through the race — here it climbs above 100% mid-race, then falls into the high 90s by the line, because horses naturally slow late.
- ✓ Green beats par; red falls short of it. The colour is the verdict — you don't even have to read the number.
- ✓ Finishing Speed % is each horse's closing speed as a percentage of its own race average. So a horse can read below 100% and still beat par at the finish — the mark of a strong, sustained run.
In the Royal Hunt Cup above, the winner Rogue Diplomat finished on 98.4% — under 100, but comfortably past the 97.3% par at the line. The bare result called it a 33/1 shock; the sectionals called it the only horse finishing.
Thirteen tabs of split-time truth on every covered race
Open any past race's result, expand Sectional Analysis, and you have the engine room: heat-mapped grids and charts for every runner at every gate, the ground-adjusted par alongside, and the upgrade angles that show who ran better than they finished.
MetricsTimesFSP%PositionTime DiffFSP% DiffCumulativeHeat MapStrideTop SpeedFSP% EfficiencyUpgradesRunning Style
Trim a busy field to the first three, five or six home, compare any two horses head-to-head, drop the run from the stalls, or switch between seconds, mph and kph — every control runs across all thirteen tabs.
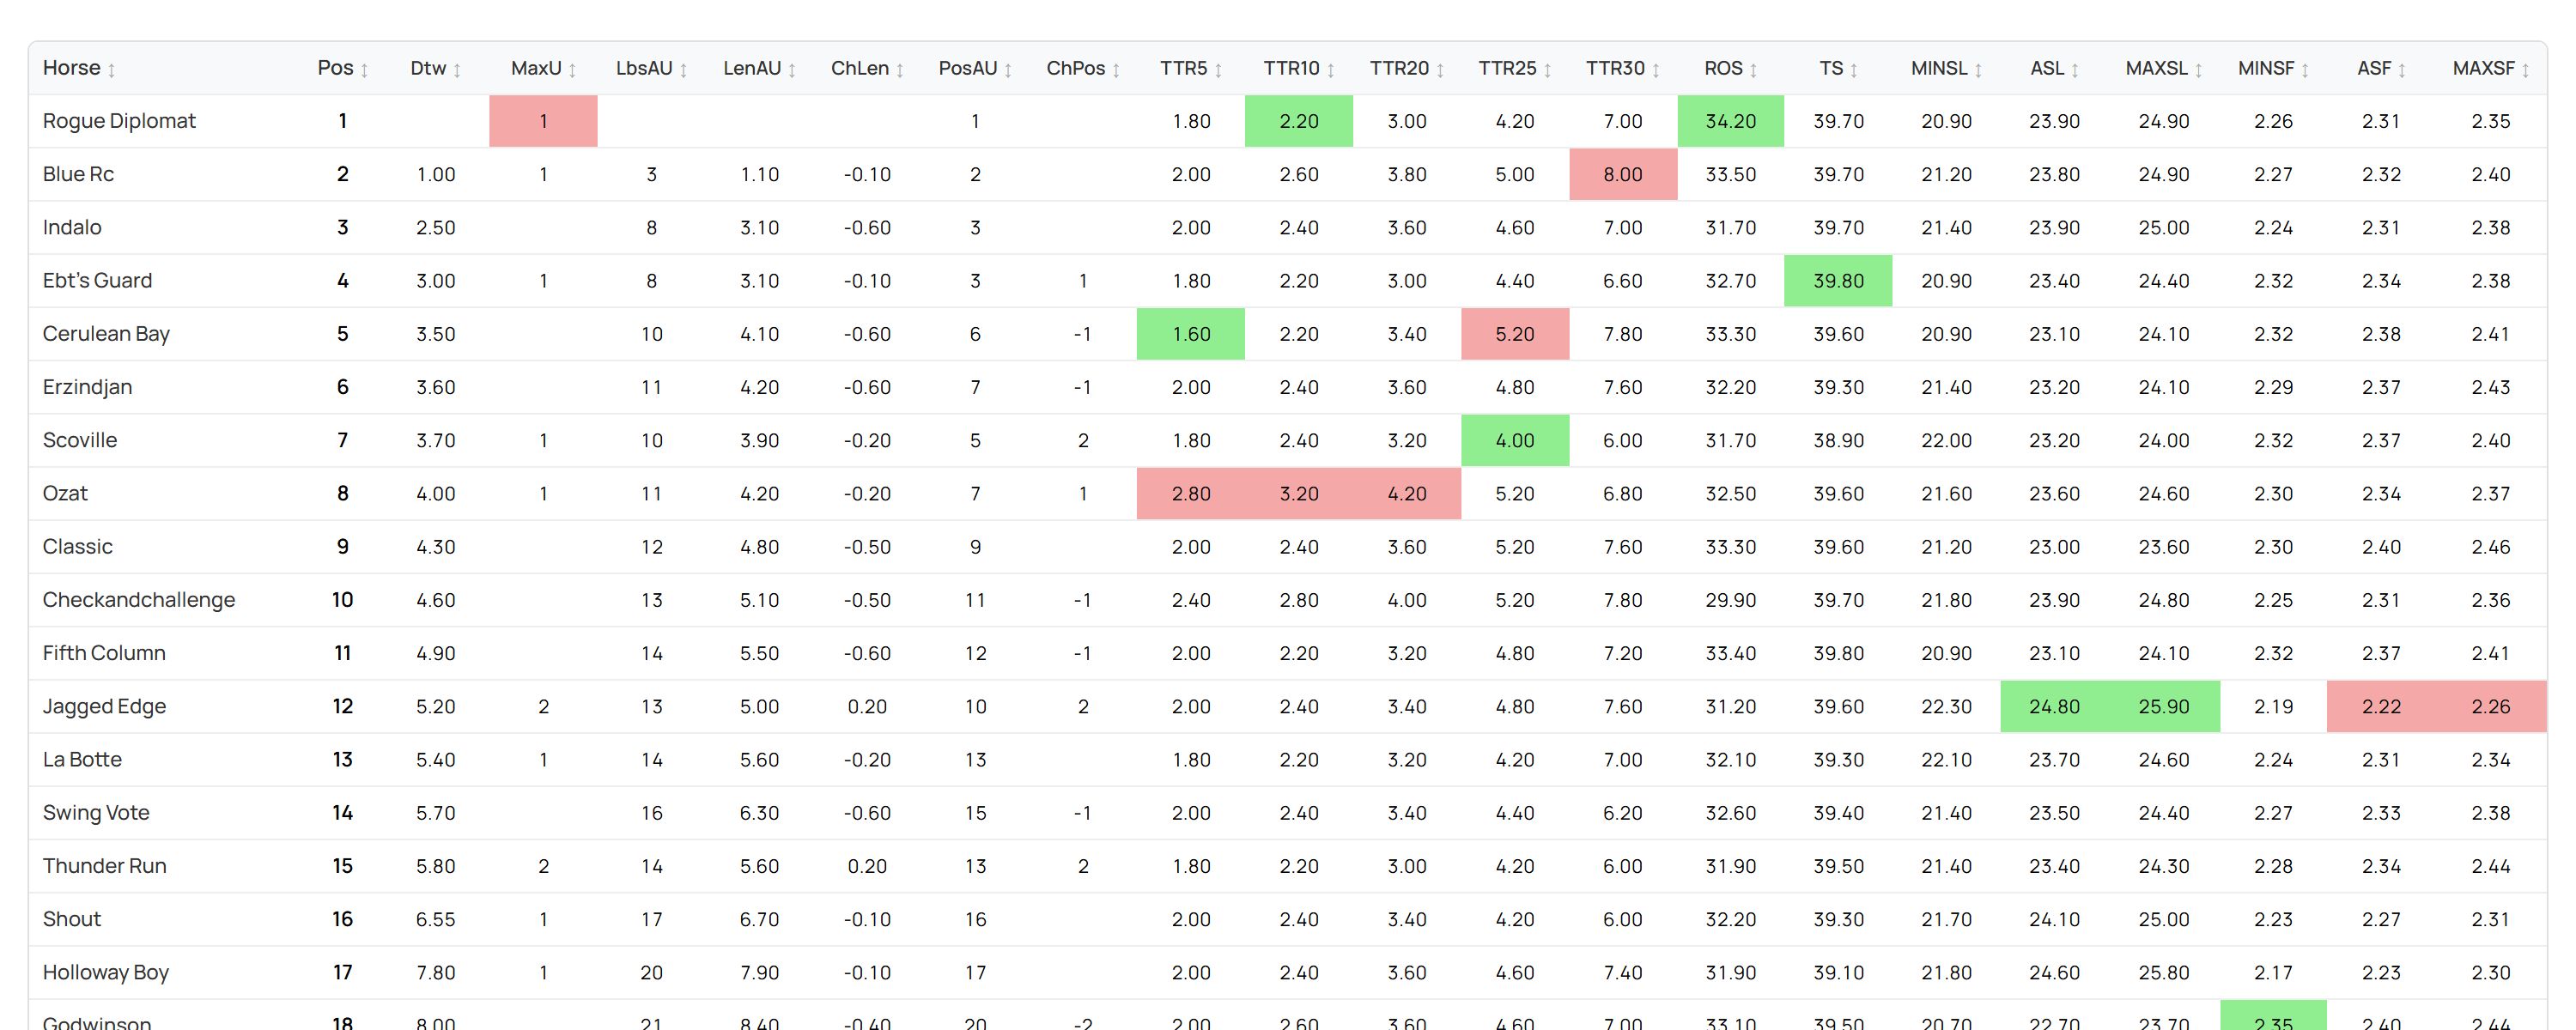
The Metrics tab — the whole of sectionals in one table, best in green, worst in red
The whole field's stride DNA, on one screen
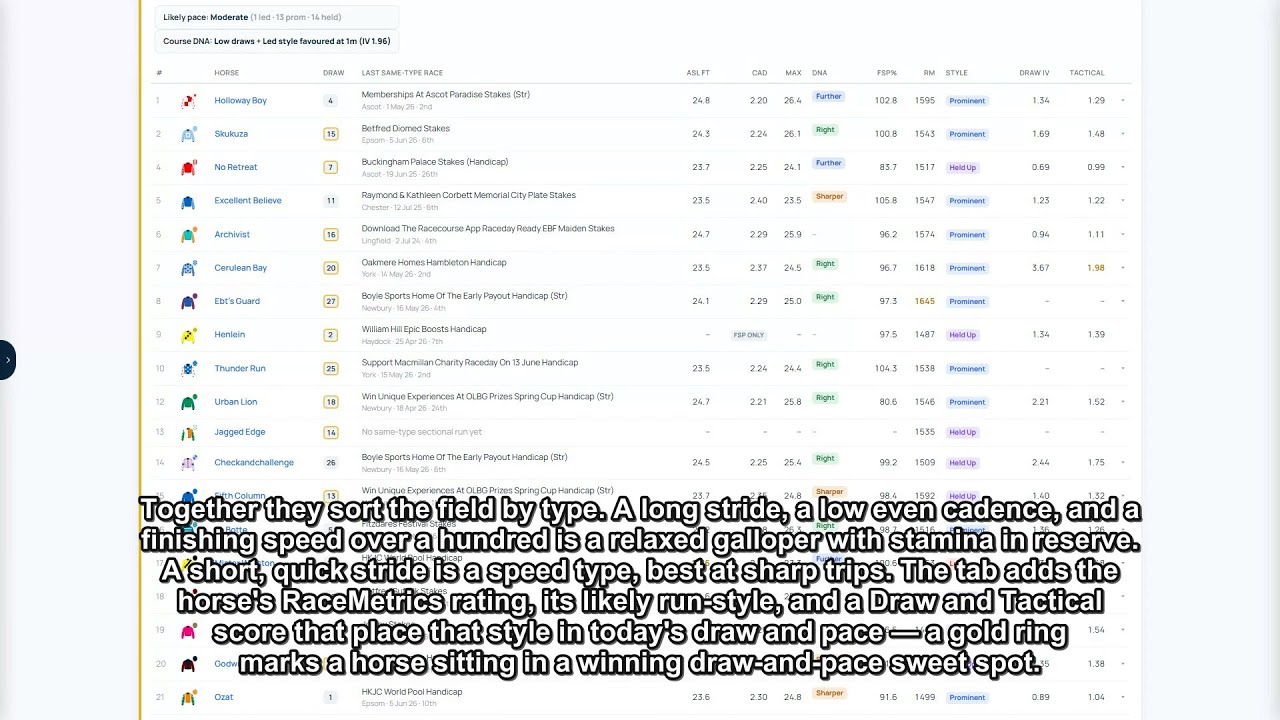
A racecard tab that draws every runner's stride and sectional snapshot from its most recent race of the same type — so you're always comparing like with like, before a stride is run.
- ✓ Average stride length, cadence, peak stride and finishing speed for every runner
- ✓ A Distance DNA verdict and the day's draw & pace sweet spot built in
- ✓ Tap any runner for a furlong-by-furlong stride map of that race
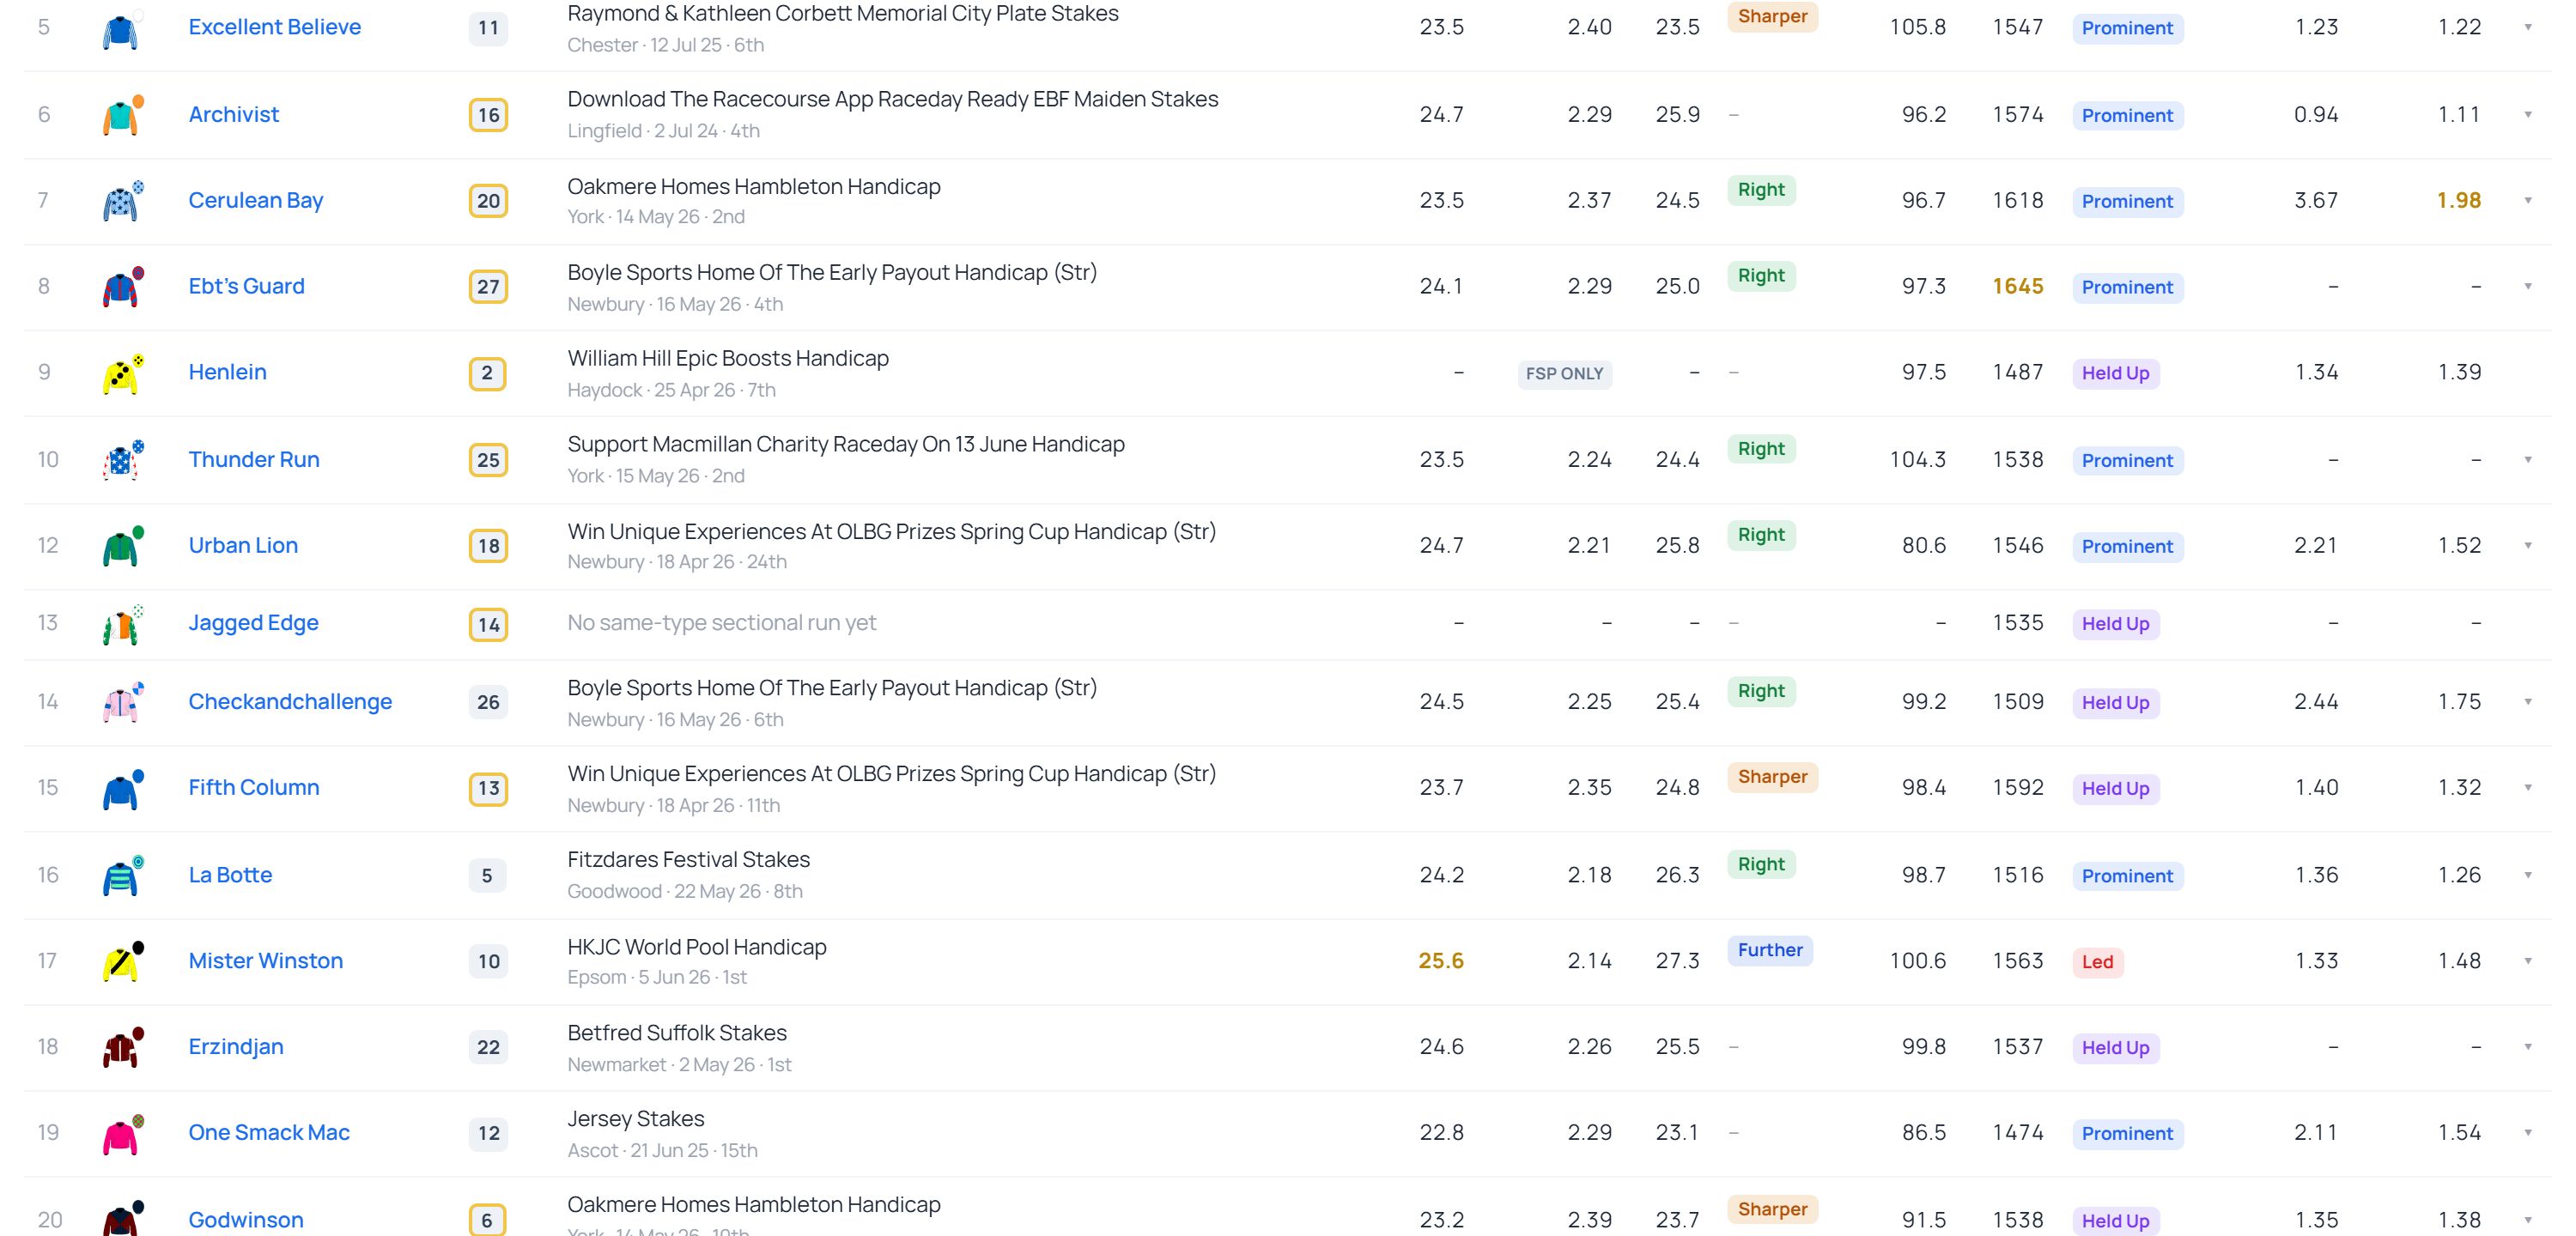
Sectional Profile — stride length, cadence, finishing speed and Distance DNA for the field
How the race will be run, before it's run
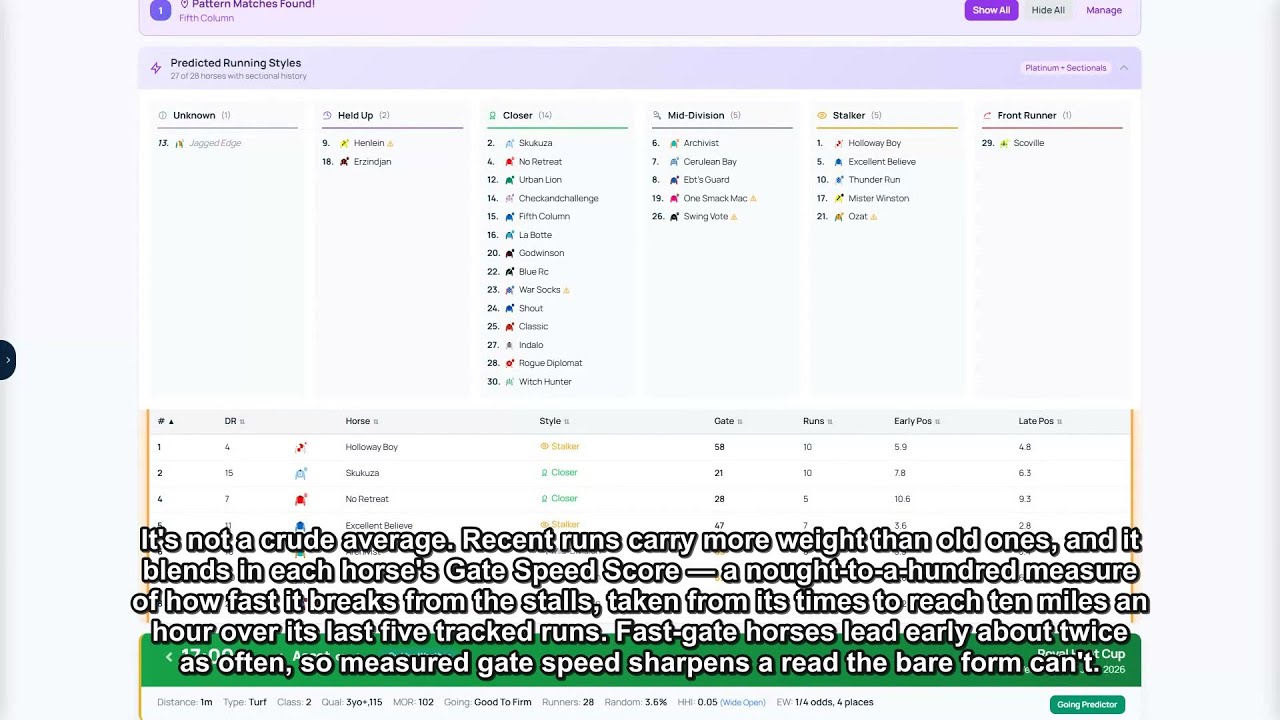
Every runner classified Front Runner to Held Up from where it has actually raced in its last ten runs with sectional data — weighted to recent form and sharpened by a measured Gate Speed Score.
- ✓ Spot the lone leader, the pace duel, the hold-up horse who needs luck
- ✓ Early and late average positions show who finishes their races out
- ✓ A caution flag whenever there are fewer than three runs to go on
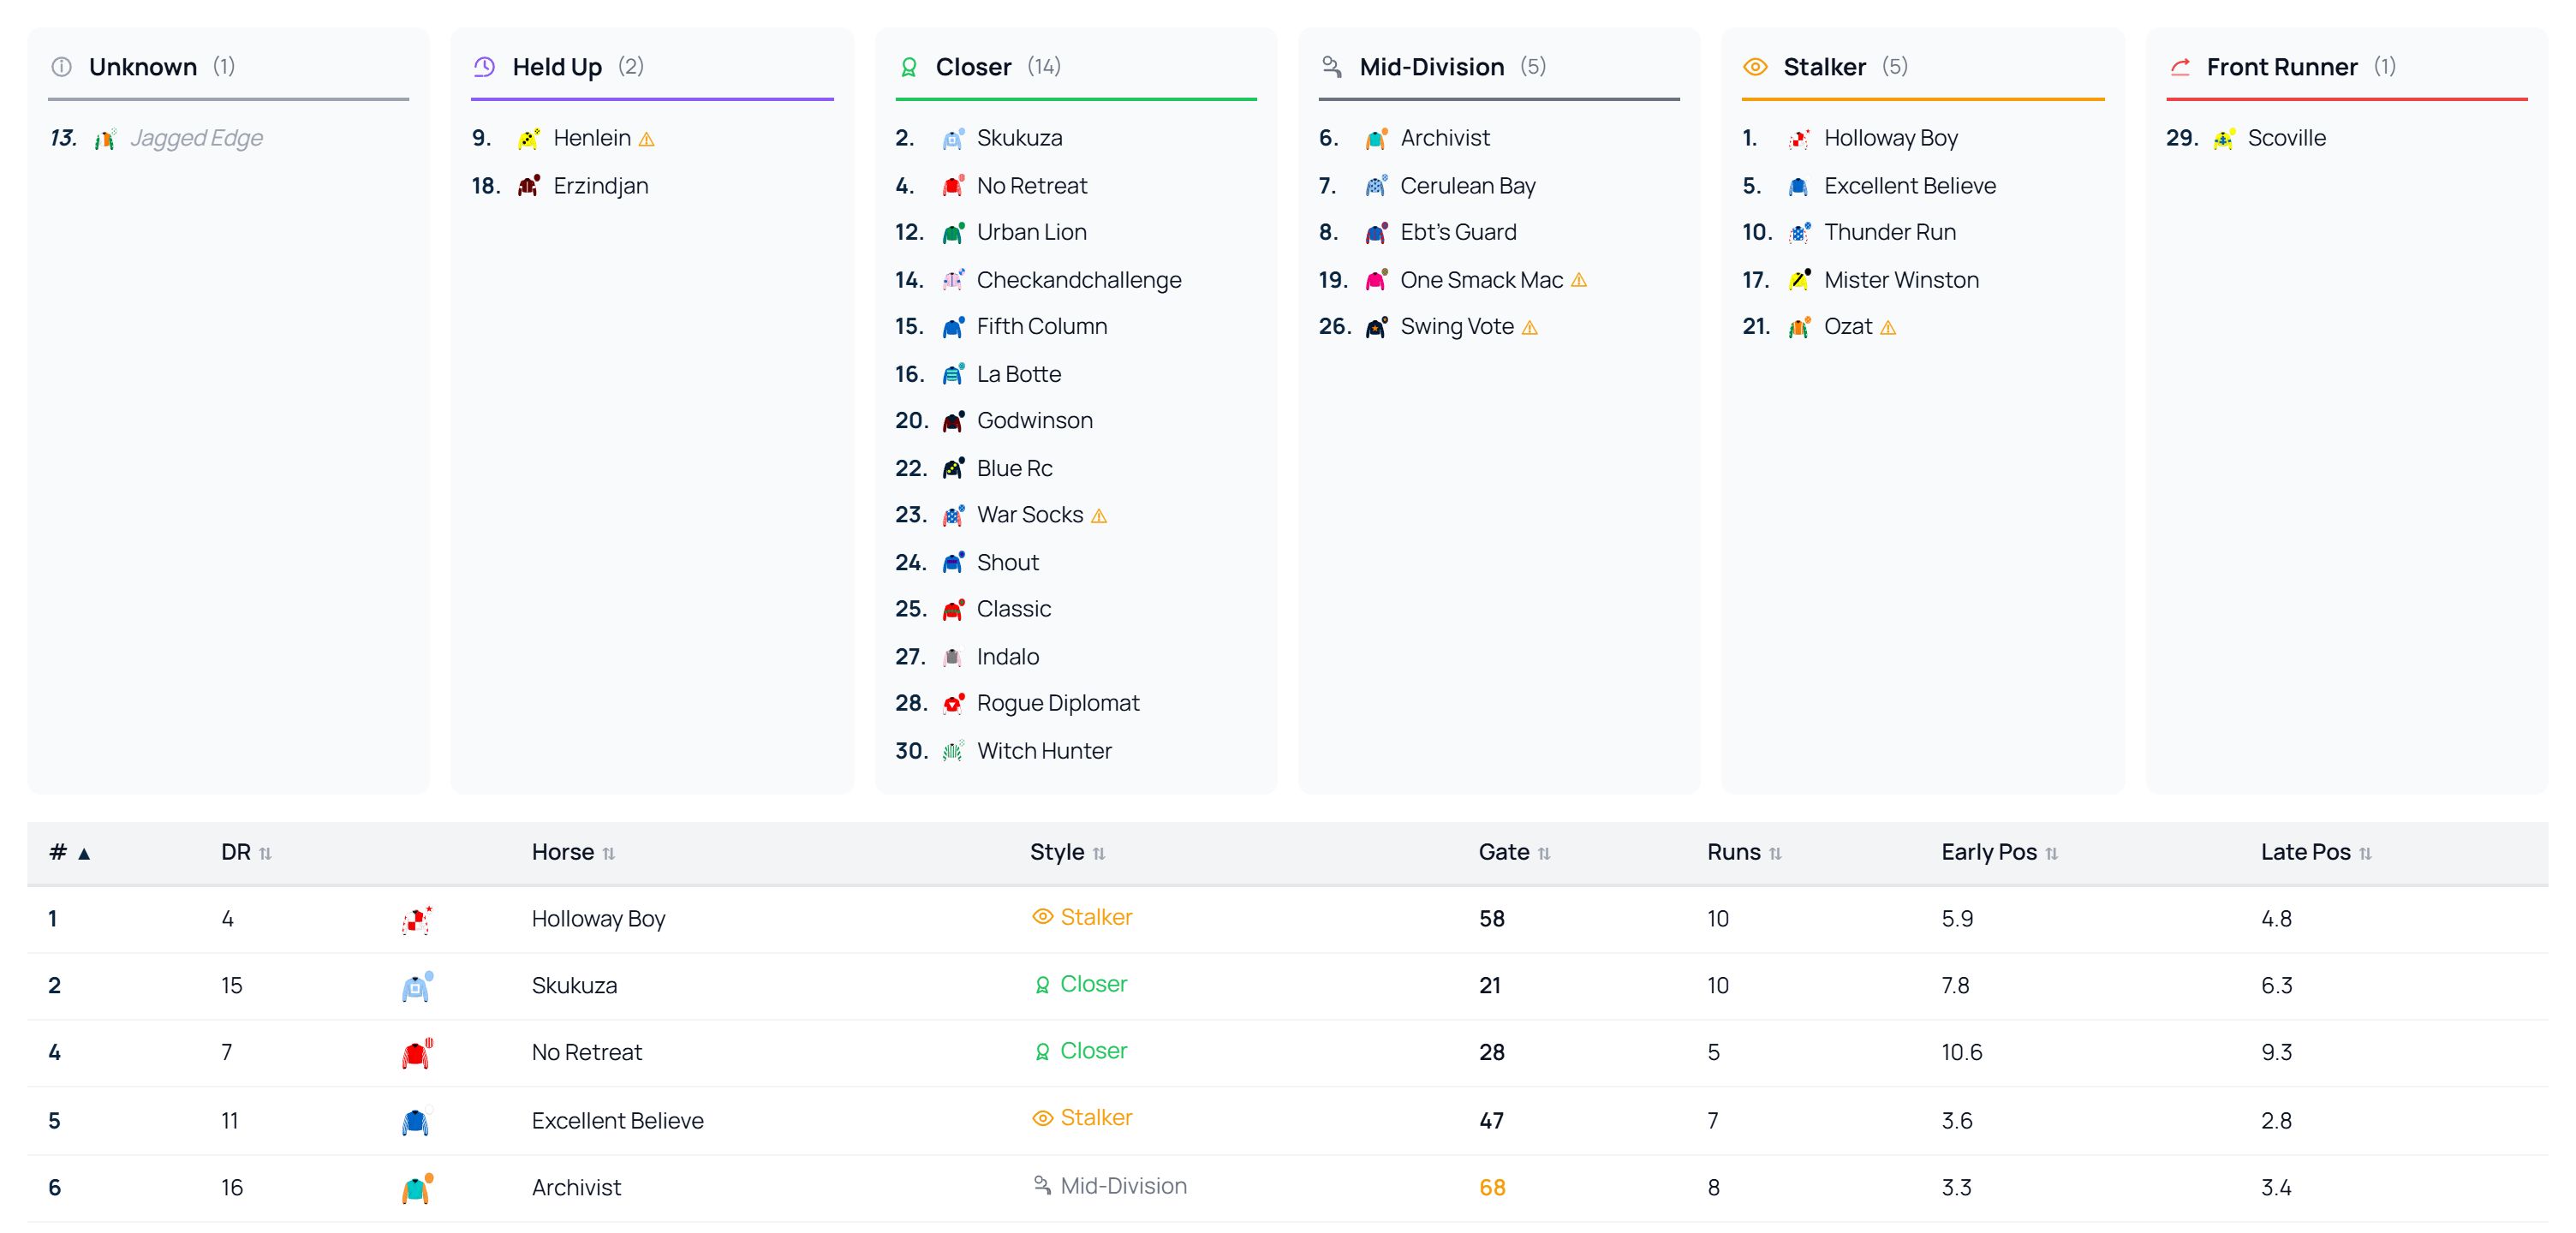
Predicted Running Styles — one lone front runner against fourteen closers told the Royal Hunt Cup story in advance
A whole card's pace picture, at a glance
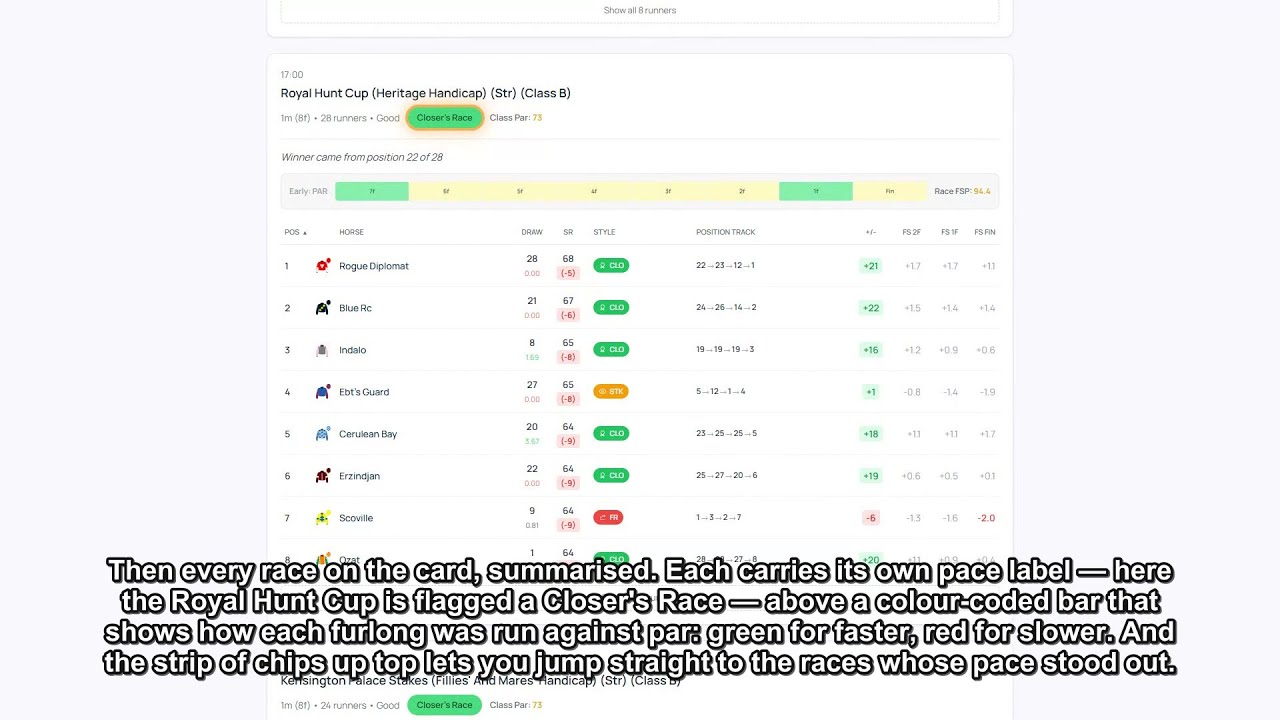
Read after the racing: the day's overall pace and draw bias up top, then every race summarised with its own pace label and a colour-coded bar of how each furlong ran against par. The fastest way to see which races the pace shaped — and how the whole card was riding.
- ✓ Meeting-level read — a Closer's Day, a High Draw Bias — in two lines
- ✓ Per-race pace labels and a colour-coded furlong-by-furlong pace bar
- ✓ Jump straight to the races whose pace scenario stands out
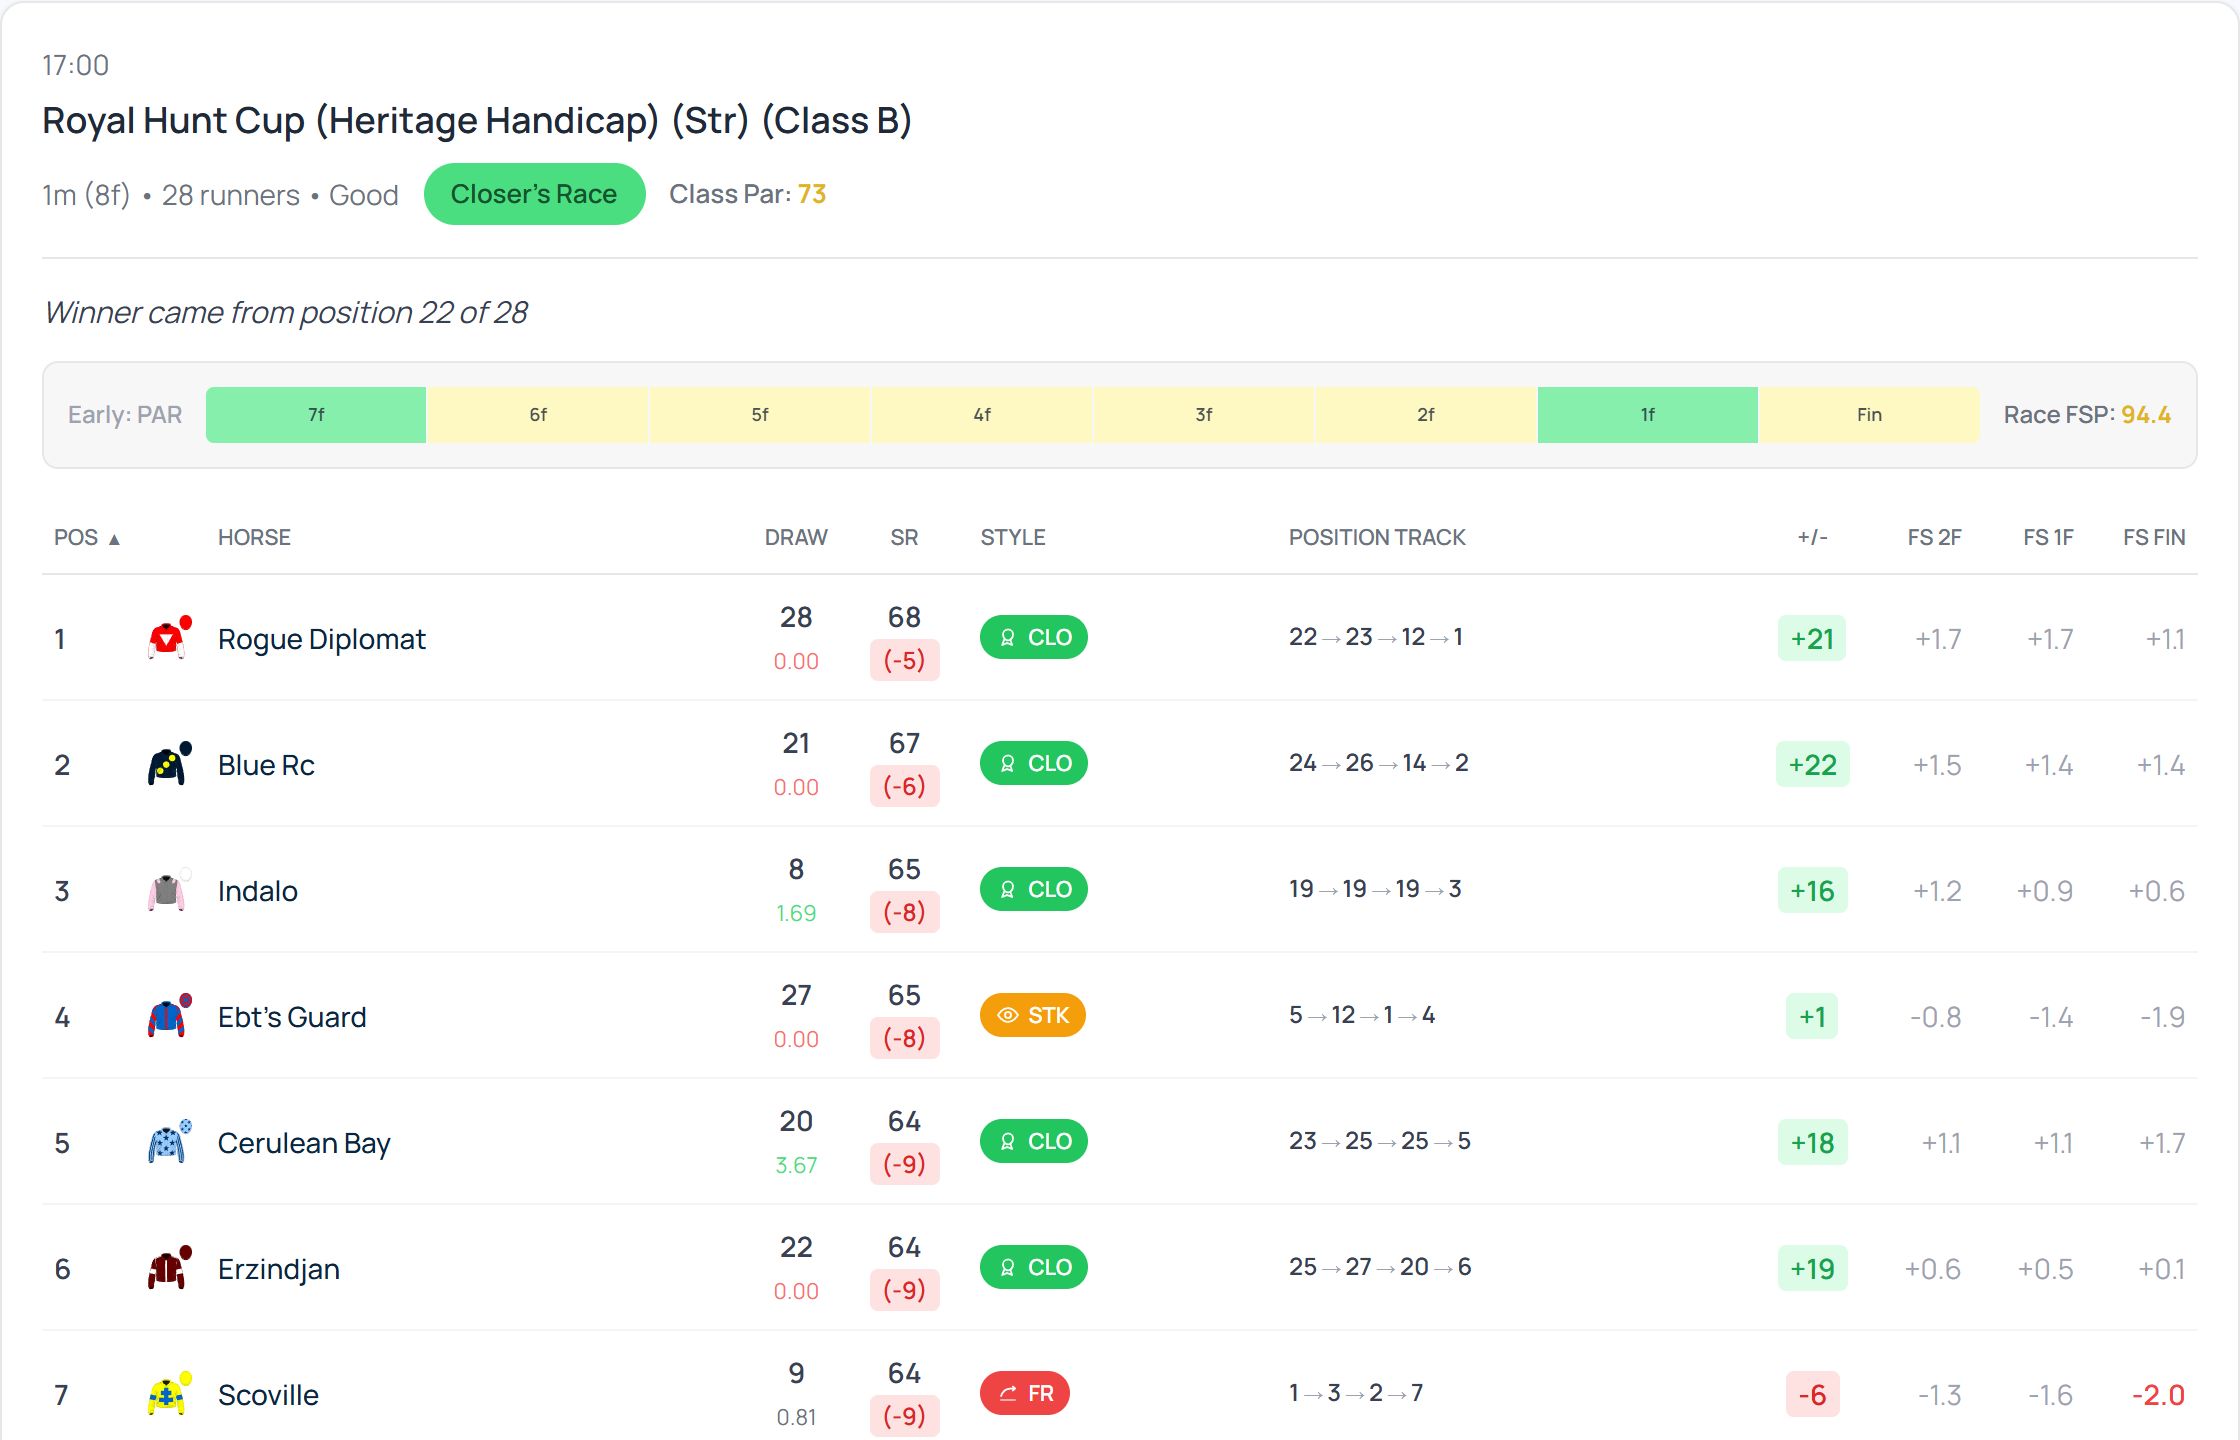
Meeting Pace — the Royal Hunt Cup flagged a Closer's Race, won from 22nd of 28
Distance DNA, Full of Running & sectional form lines
- ✓ Distance DNA — a stride-based answer to the oldest question in the form book: does this horse want further, or shorter? It compares a horse's own cadence to the winners' at the trips it has been running.
- ✓ Full of Running — a beaten horse that crossed the line with plenty left (a top-2 run-out speed and a faster-than-par finish) wears a green FoR LTO badge until it runs again. These win about 16% next start against a 10% baseline.
- ✓ Sectional form lines — one click swaps a horse's form to its sectional read of every past run: Race Pace, running style, positions gained, the adjusted finish and Max Upgrade.
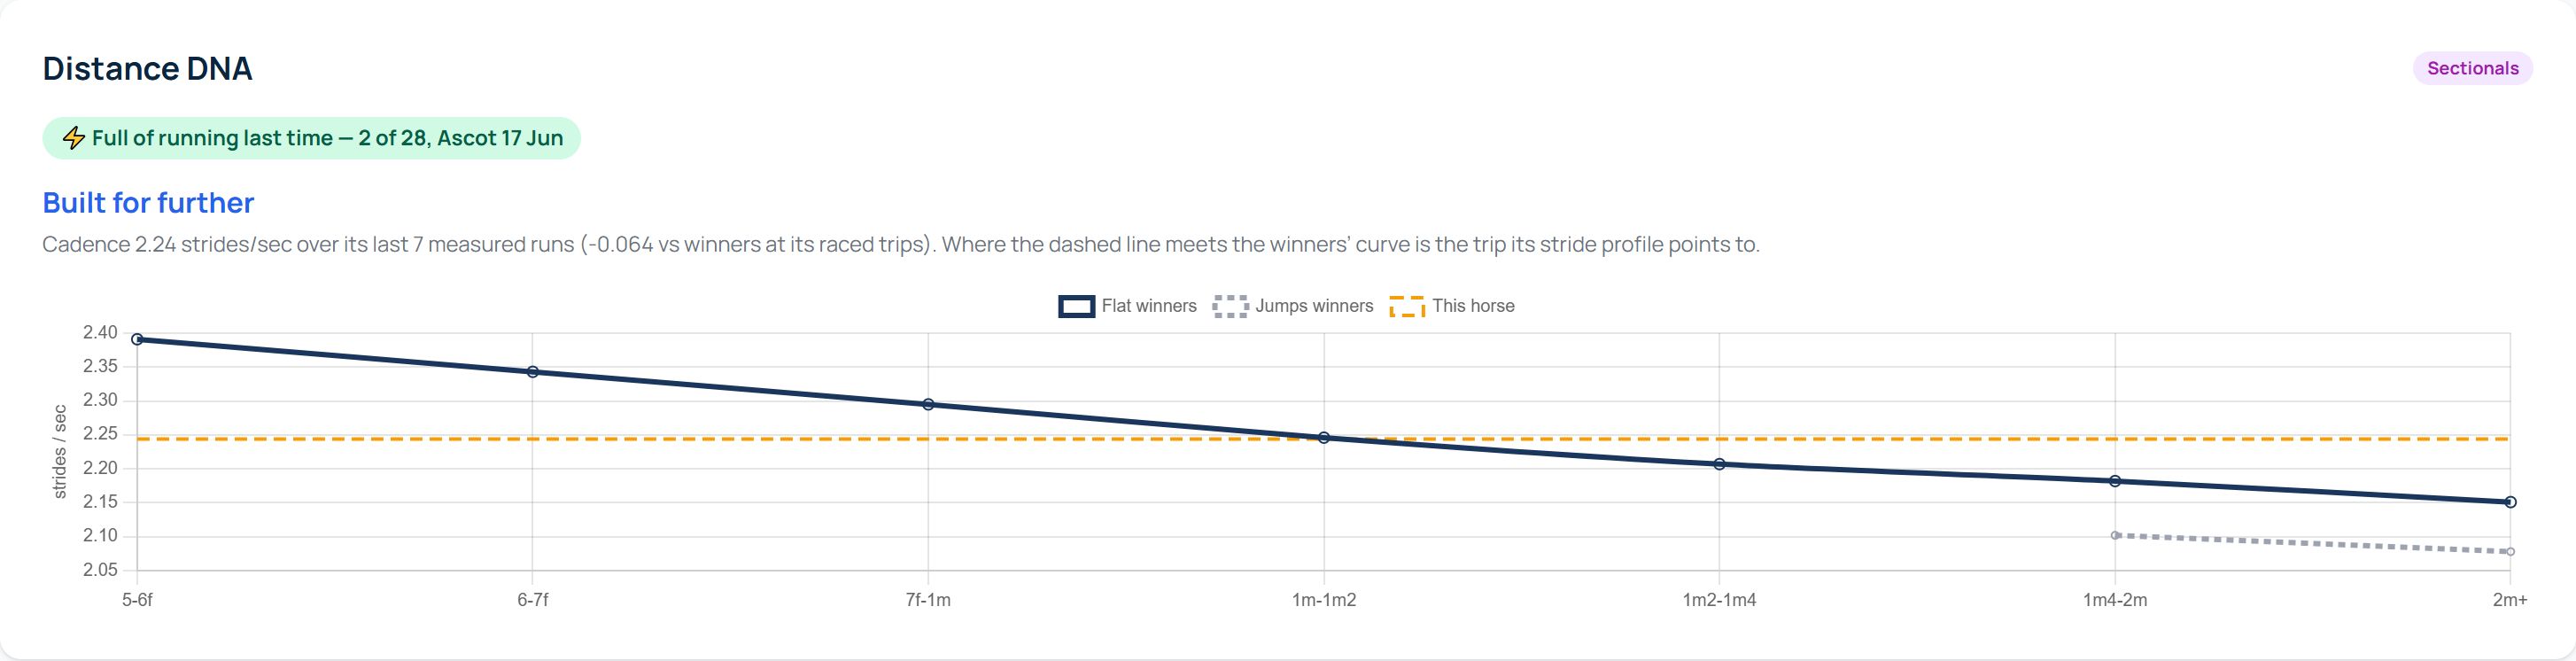
Distance DNA & the Full-of-Running flag on a horse profile
Eleven short videos — one for every feature
A complete, narrated tour of the sectionals toolkit, read on a single race so it all joins up: the 28-runner Royal Hunt Cup at Royal Ascot. Watch the full series on YouTube, or pick a feature below.
Watch the full playlist on YouTubeAfter the race — the Analysis Suite
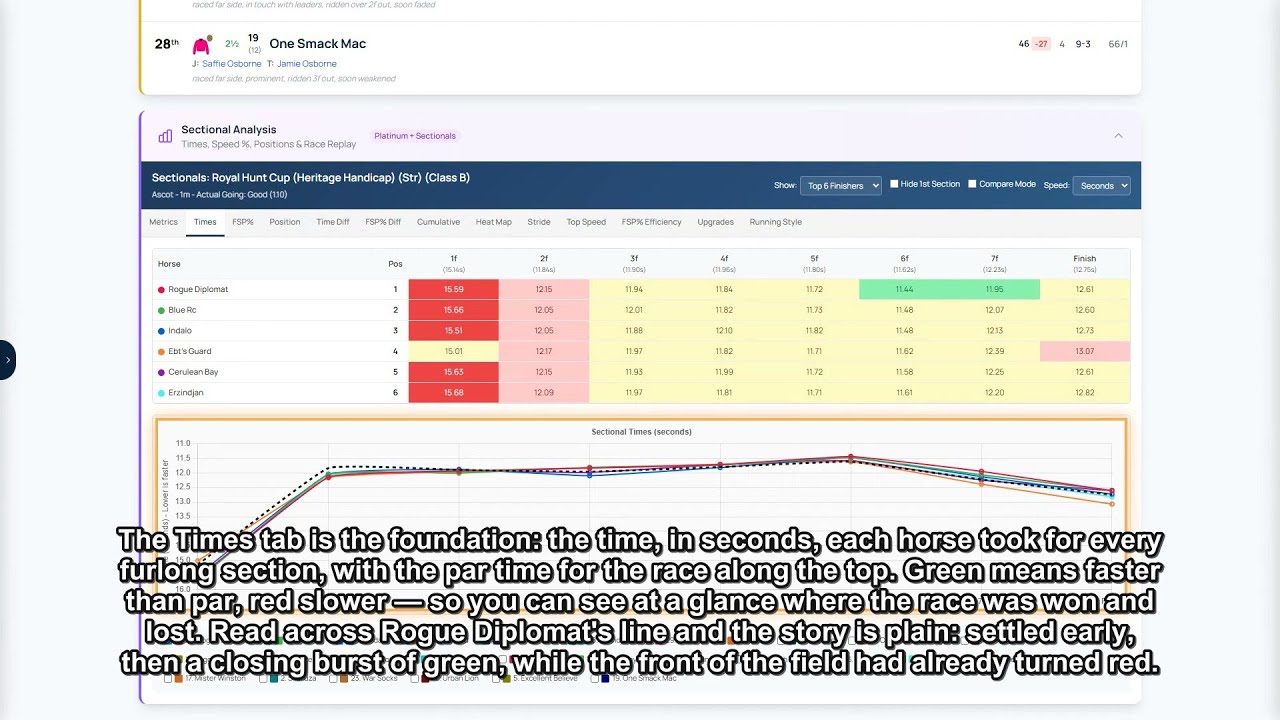
Times, Time Diff, Cumulative & Heat Map
Opening the workspace, the control bar, and the time-vs-par family.

Finishing Speed — FSP%, Diff & Efficiency
Closing speed vs a horse's own average, read against par.

Position & Running Style
Where every horse ran, and how it likes to be ridden.

Top Speed & Stride
How fast — and how: stride length against cadence.

Metrics & Upgrades
The one-table overview, and who ran better than they finished.

Sectional Analysis from any result
The quick way in when a result surprises you.
Before the race — on the racecard
Sectional Profile
The field's stride DNA, like-for-like, before the off.
Predicted Running Styles
The pace map, built from sectional history and gate speed.

Sectional form lines
Sectionals woven into the form you already read.
The wider read & profile signals

Every sectional reference in one place
Full reference for all thirteen analysis tabs and the controls.
How to read stride length, cadence and the Distance DNA column.
Finishing Speed %, and how it's judged against par.
The terms, defined — section times, positions, stride and more.
How a horse's break from the stalls is measured and scored.
The run-out-speed flag and the next-time-out edge behind it.
Where the Sectionals Add-On sits across the RaceMetrics tiers.
Every other feature, explained.
Add TPD Sectionals to Proform Premium at proformracing.com.
Ready to see racing properly?
The Sectionals suite is part of Proform Premium with the TPD Sectionals Add-On. One subscription, every feature on this page.